
Viewing Cost Analyses (New Edition)
On the Cost Analysis page, you can view the analyses of original costs and amortized costs. You can also specify a time range and view cost analyses at daily-, monthly-, or hourly-granularity if enabled on the Preferences page. In addition, you can select different dimensions or filters to dig deeper into cost data. For the scope of cost data you can analyze, see Data Scope.
API Reference
For details about how to use APIs to view cost analyses, see Querying Cost Data.
Preconfigured Reports
Cost Center comes preconfigured with some reports for typical cost analysis scenarios. You can also create custom reports to meet your own requirements. You can add the frequently used reports to your favorites for faster cost analysis.

Preconfigured reports cannot be deleted, but you can copy or add them to your favorites.
Report Name |
Description |
|---|---|
Monthly Costs by Service Type |
Shows the monthly costs by service type. You can learn which types of services have had the highest original costs over the last six months. |
Monthly Amortized Costs |
Shows the monthly costs amortized over the last six months. |
Daily Costs |
Shows the daily original costs over the last three months and in the following one month. |
Monthly Costs by Linked Account |
Shows the monthly costs by linked account. You can learn the linked accounts with highest original costs over the last six months. |
Monthly Costs by Enterprise Project |
Shows the monthly original costs for each enterprise project over the last six months. |
Monthly Costs by Region |
Shows the monthly original costs for each region over the last six months. |
Pay-Per-Use ECS Monthly Costs and Usage |
Shows the monthly original costs and usage of pay-per-use ECSs over the last six months. |
Cost Analysis View

You can set the cost type, time, and filters to view your cost data. If needed, you can also modify advanced settings to meet your specific requirements. In addition, you can export the desired cost and usage details for downloading and viewing.
Display Dimensions
By default, Cost Center provides you with an analysis of original costs (amount due).
Cost Type
- Original costs (amount due): the costs of cloud services purchased at the list price with available discounts applied. Before the billing date, this is an estimated amount.
- Net original costs (actual payments): the original costs after cash coupons are applied. Before the billing date, this is the estimated amount without any cash coupons applied.
- Amortized costs (amortized amount due): the effective costs after the original costs are amortized on a daily basis. For details about how to calculate amortized costs, see Cost Amortization Rules. Before the billing date, this is an estimated amount.
- Net amortized costs (amortized actual payments): amortized costs after cash coupons are applied. Before the billing date, this is the estimated amount without any cash coupons applied.
Dimensions/Filters
You can use different dimensions to identify the resource types, regions, or linked accounts that have incurred highest costs.
You can use the dimensions and filters listed below for cost analysis.
Dimension/Filter |
Description |
|---|---|
Service Type |
Type of a cloud service. Example: Elastic Cloud Server (ECS) |
Resource Type |
The type of the resources of a cloud service. Example: Cloud servers |
Linked Account |
The Huawei Cloud account that the cloud resources belong to. If you are using a master account, you can select your associated member accounts to view their cost data. |
Region |
A cloud service region that provides public cloud service resources independently and serves a large geographical area. |
AZ |
A physically isolated zone where resources have their own independent power supply and internal networks. One region can have multiple AZs, and if one AZ becomes faulty, the other AZs in the same region can still provide services. AZs in the same region can access each other as they are on the same intranet. |
Enterprise Project |
The enterprise project selected when you purchased cloud resources. If you have not organized your resources by enterprise project, the following may occur:
NOTE:
An enterprise master account can select enterprise projects by linked account, except the default enterprise project and those not categorized. |
Specifications |
Specifications of cloud services. |
Billing Mode |
Billing modes include yearly/monthly, pay-per-use, and reserved instance. |
Usage Type |
The way a pay-per-use cloud service is billed. |
Bill Type |
The type of a billing item. Example: expenditure-purchase and expenditure-hourly billing |
Business Entity |
The business entity that a cloud service belongs to. Example: Huawei Cloud |
PayerAccount Name |
The account used to pay for Huawei Cloud resources.
|
Cost Tags |
Used to track costs of resources associated with each other in an enterprise. For more information, see Activating Cost Tags. If you are using a member account associated for unified accounting, you can only use the cost tags activated by the master account. |
Resource Name/ID |
The name or unique ID of a cloud service resource. |
Cost Categories |
A tool used to automatically group your costs based on the defined rules. For details, see Overview of a Cost Category. If you are using a member account associated for unified accounting, you can only use the cost categories created by the master account. |
Specifying a Time Range
You can view your cost data at a specific granularity within a given time range.

Granularity
- Daily: View cost data by the day.
- Monthly: View cost data by the month.
- Hourly: View cost data from the last 14 days by the hour.
Time Range
- 7D: the cost data for the last 7 days (excluding the current day)
- 14D: the cost data for the last 14 days (excluding the current day)
- 30D: the cost data for the last 30 days (excluding the current day)
- MTD: the month-to-date cost data
- 3M: the cost data for the last 3 months (excluding the current month)
- 6M: the cost data for the last 6 months (excluding the current month)
- 12M: the cost data for the last 12 months (excluding the current month)
- YTD: the year-to-date cost data
- Current Month: If there is sufficient historical cost data, the cost data generated in the past days of the month and the forecasted cost data in the coming days of the month will be displayed.
- +1M: If there is sufficient historical data, the forecasted cost data of the next month will be displayed.
- +3M: If there is sufficient historical data, the forecasted cost data of the next 3 months will be displayed.
- +6M: If there is sufficient historical data, the forecasted cost data of the next 6 months will be displayed.
- +12M: If there is sufficient historical data, the forecasted cost data of the next 12 months will be displayed.
- Custom: You can select a specific time range for data query.

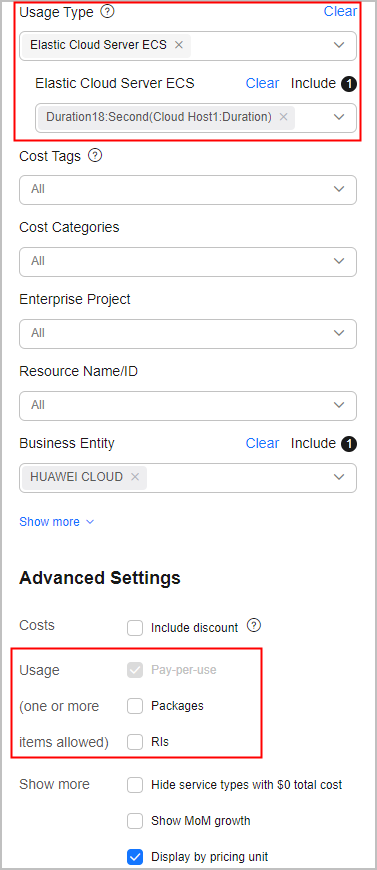
Setting Filters
You can select any combination of filters to control which datasets are displayed.
If you select multiple filters, only results meeting all filtering criteria will be displayed. However, if you select multiple items for any given filter, results meeting any of the items selected will be displayed.
Example 1 |
Example 2 |
|---|---|
When you filter data based on the filter criteria below, the cost data meeting all these requirements will be displayed.
|
When you filter data based on the filter criteria below, the cost data meeting all these requirements will be displayed.
|


You can select up to 50 items for each filter. Under the Cost Category or Cost Tag filter, you can select up to 20 items for a level-1 option and up to 50 items for a level-2 option at a time.
As shown in the following figure, the option marked with the red box is considered a level-1 option, and the options marked with the blue box are considered level-2 options.

You can use the filters listed below for cost analysis.
Filter |
Description |
|---|---|
Service Type |
Type of a cloud service. Example: Elastic Cloud Server (ECS) |
Resource Type |
The type of the resources of a cloud service. Example: Cloud servers |
Linked Account |
The Huawei Cloud account that the cloud resources belong to. If you are using a master account, you can select your associated member accounts to view their cost data. |
Region |
A cloud service region that provides public cloud service resources independently and serves a large geographical area. |
AZ |
A physically isolated zone where resources have their own independent power supply and internal networks. One region can have multiple AZs, and if one AZ becomes faulty, the other AZs in the same region can still provide services. AZs in the same region can access each other as they are on the same intranet. |
Enterprise Project |
The enterprise project selected when you purchased cloud resources. If you have not organized your resources by enterprise project, the following may occur:
NOTE:
An enterprise master account can select enterprise projects by linked account, except the default enterprise project and those not categorized. |
Specifications |
Specifications of cloud services. |
Billing Mode |
Billing modes include yearly/monthly, pay-per-use, and reserved instance. |
Usage Type |
The way a pay-per-use cloud service is billed. |
Bill Type |
The type of a billing item. Example: expenditure-purchase and expenditure-hourly billing |
Business Entity |
The business entity that a cloud service belongs to. Example: Huawei Cloud |
PayerAccount Name |
The account used to pay for Huawei Cloud resources.
|
Cost Tags |
Used to track costs of resources associated with each other in an enterprise. For more information, see Activating Cost Tags. If you are using a member account associated for unified accounting, you can only use the cost tags activated by the master account. |
Resource Name/ID |
The name or unique ID of a cloud service resource. |
Cost Categories |
A tool used to automatically group your costs based on the defined rules. For details, see Overview of a Cost Category. If you are using a member account associated for unified accounting, you can only use the cost categories created by the master account. |
Advanced Settings
Costs
When Cost Type is set to Original costs (amount due), you can select or deselect Include discount. If you select this option, discounts and truncated amounts will be included, and the cost is equal to the list price.
Show MoM growth
- PoP cost = Total cost of the current period – Total cost of the last period
- PoP growth is calculated as follows:

You can select Show MoM growth to see the details.
Show list price
The list price is the price of a product without any discounts applied. If you select this option, the list price will be displayed only for analysis of original costs in stacked charts.
Cost and Usage Summary
Total cost: total cost in each day or month. If the time range you select includes a point in time in the future, the total cost includes the forecasted cost. If the time range does not include any time in the future, the total cost does not include the forecasted cost.
Average monthly cost: the average cost over the selected time range at a certain time granularity.

In Cost Center, you can also view cost data in stacked charts, bar charts, and line charts.
A maximum of 11 data records can be displayed in a chart. If you select 11 or more data records, the top 10 data records and Other are displayed by default. Other indicates the total number of the remaining data records.
- Stacked chart
Figure 1 Stacked chart

- Bar chart
Figure 2 Bar chart

- Line chart
Figure 3 Line chart

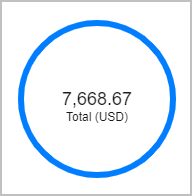
- Donut chart
Figure 4 Donut chart
Creating a Custom Report
- Log in to Cost Center.
- Choose Cost Insights > Cost Analysis.
- Click Create Custom Report under All Reports.
- Configure filters in the displayed page.
- Click Save on the upper right corner.
- Specify a name for the report, and click Save.

Viewing Cost Analyses
- Log in to Cost Center.
- Choose Cost Insights > Cost Analysis.
- Select a recommended report or a custom report.
Huawei Cloud provides recommended reports for quick cost analysis.
You can save your cost analyses as custom reports if needed.
- Set search criteria to view desired cost data.

- If you set Cost Type to Original costs (amount due) or Net original net costs (actual payments), the data displayed on the page is nearly real-time.
- If you set Cost Type to Amortized costs (amortized amount due) or Net amortized costs (amortized actual payments), it may take 24 to 48 hours before the most recent data is displayed.
- You can click Export to access the Export History page and download the Cost Analysis - Overview file.
- Click Save in the right upper corner of the page to save the analyses as reports so that you can easily view cost analyses with the same filters. When you view a saved report later, Cost Center displays the same type of report, but updated with the most recent data.
Viewing Usage Analyses
- Log in to Cost Center.
- Choose Cost Insights > Cost Analysis.
- Select a recommended report or a custom report.
Huawei Cloud provides recommended reports for quick cost analysis.
You can save your cost analyses as custom reports if needed.
- Under Filters, select an item for Usage Type. The usage data meeting the settings of Displayed Dimensions and Time is displayed.
Feedback
Was this page helpful?
Provide feedbackThank you very much for your feedback. We will continue working to improve the documentation.See the reply and handling status in My Cloud VOC.
For any further questions, feel free to contact us through the chatbot.
Chatbot


