Viewing the Resource Dashboard
Scenarios
You can check the resources (such as ECSs, EIPs, and cloud databases) purchased under your account and the current alarm information of the resources (the alarms are generated after Cloud Eye is configured).
Viewing the Resource Dashboard
- Log in to COC.
On the Overview page, check the information in the Resource Dashboard area. By default, resources in all regions are displayed.Figure 1 Resource information

- Click
 in the upper right corner of this area.
Synchronize resources and alarm information.
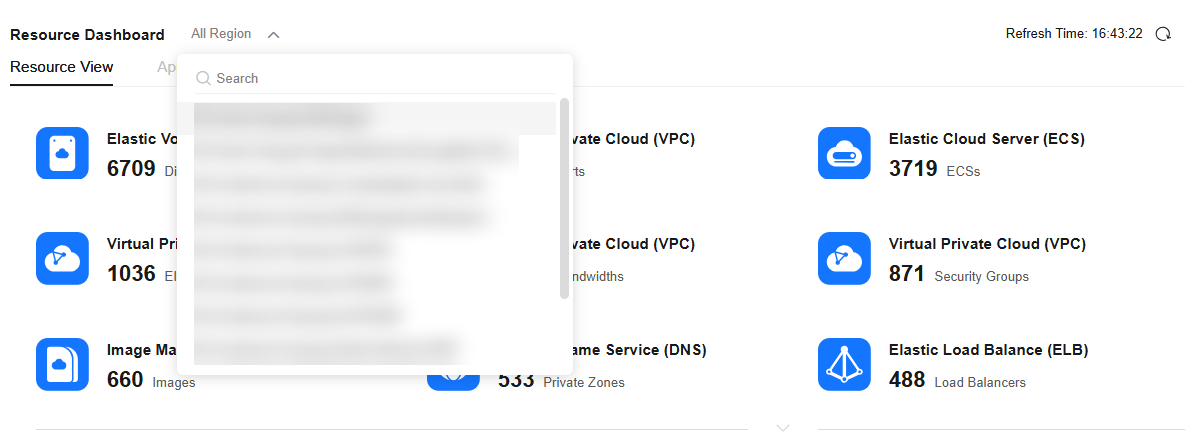
- Click All Region to choose a specified region and check resources in the region.
Figure 2 Choosing a region
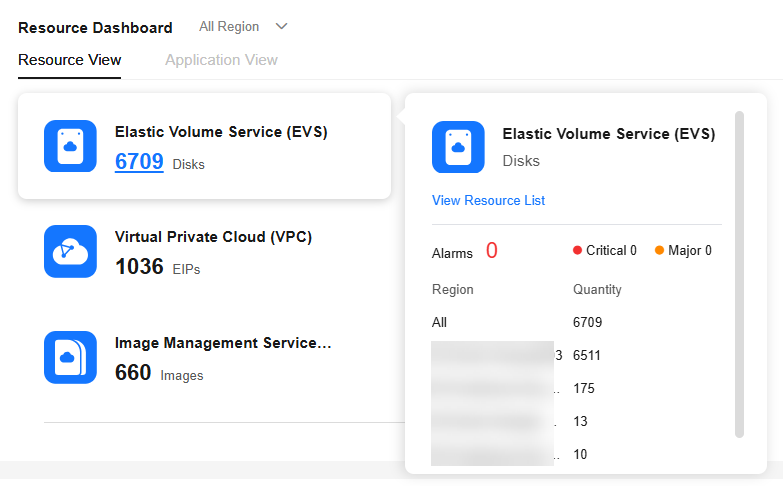
- Hover the mouse pointer over the cloud service icon.
The number of critical and major alarms and the region distribution of resource instances are displayed. The number in red in the upper right corner of the cloud service icon indicates the number of alarms.Figure 3 Checking resource information
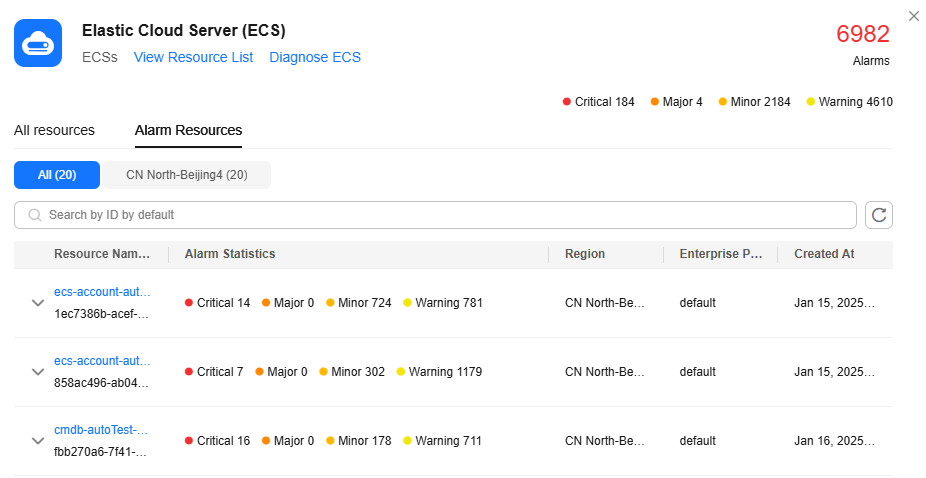
- Click the cloud service icon.
The alarm resource information of the corresponding resource type is displayed.Figure 4 Checking resource information
- Click the name of the resource you want to view. The resource details page of the service is displayed.
The resource details page of the service is displayed.
- Locate the resource to be viewed and click
 on the left of the resource name.
All alarm information (obtained from Cloud Eye) is displayed.
Figure 5 Viewing alarms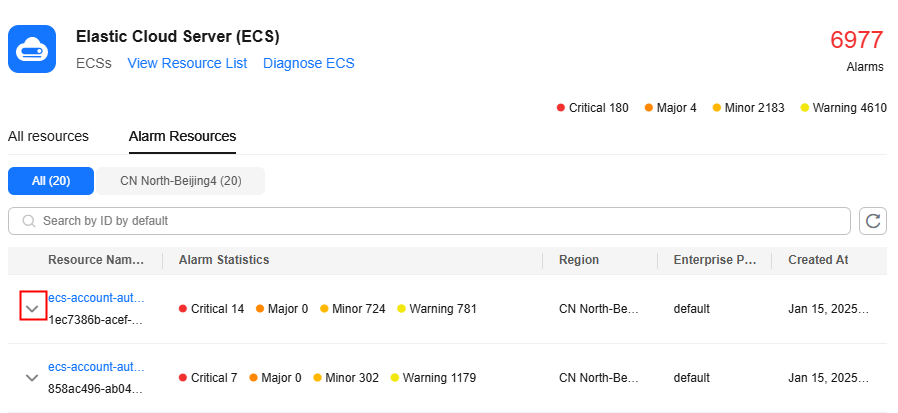
- Locate the alarm to be checked and click the alarm rule name.
The alarm rule page of Cloud Eye is displayed.
Figure 6 Viewing an alarm rule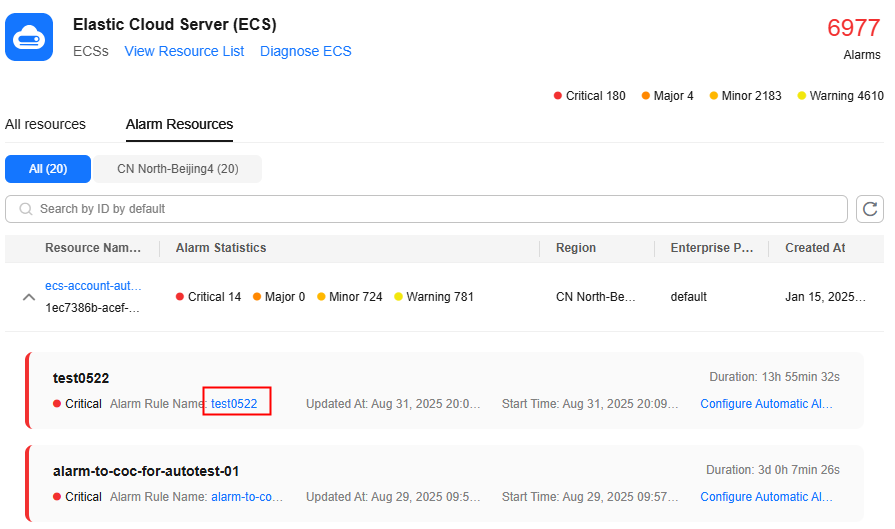
- Locate the alarm to be checked and click Automatic Alarm Handling.
Go to the response plan execution page of COC to quickly handle alarms.
Figure 7 Handling alarms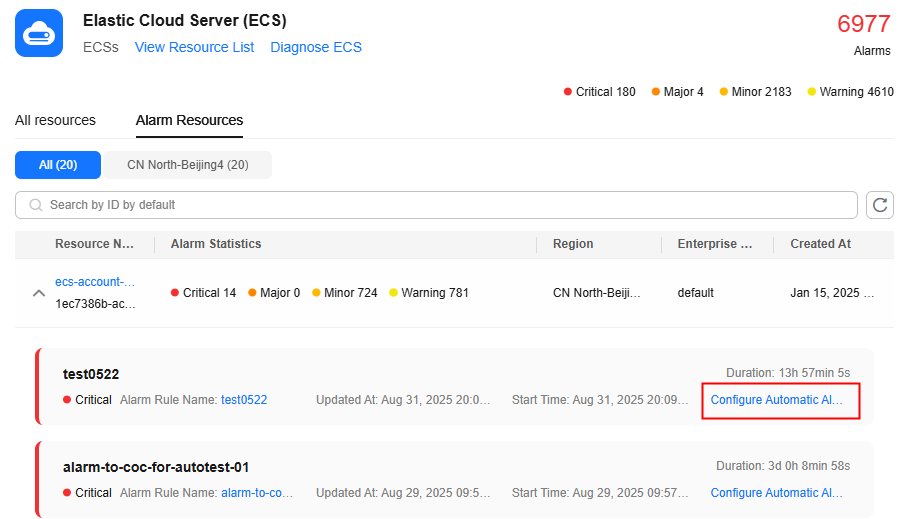
- Click the All Resources tab to view all resources of the resource type.
Figure 8 All resources
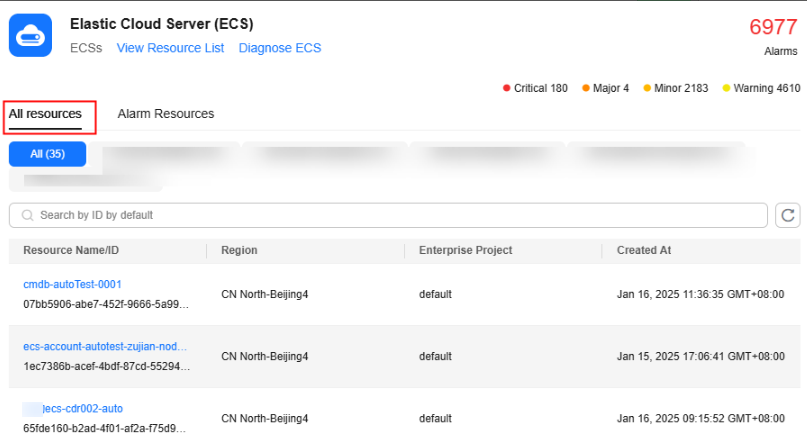
- Click the name of the resource you want to view. The resource details page of the service is displayed.
Feedback
Was this page helpful?
Provide feedbackThank you very much for your feedback. We will continue working to improve the documentation.See the reply and handling status in My Cloud VOC.
For any further questions, feel free to contact us through the chatbot.
Chatbot


