
Help Center/
Huawei Cloud Astro Canvas/
User Guide/
Widget Management/
Customizing Event Interactions for ECharts Widgets
Updated on 2025-03-24 GMT+08:00
Customizing Event Interactions for ECharts Widgets
When ECharts widgets act as event triggers, you can define interactive events in a custom event.
Customizing Event Interactions
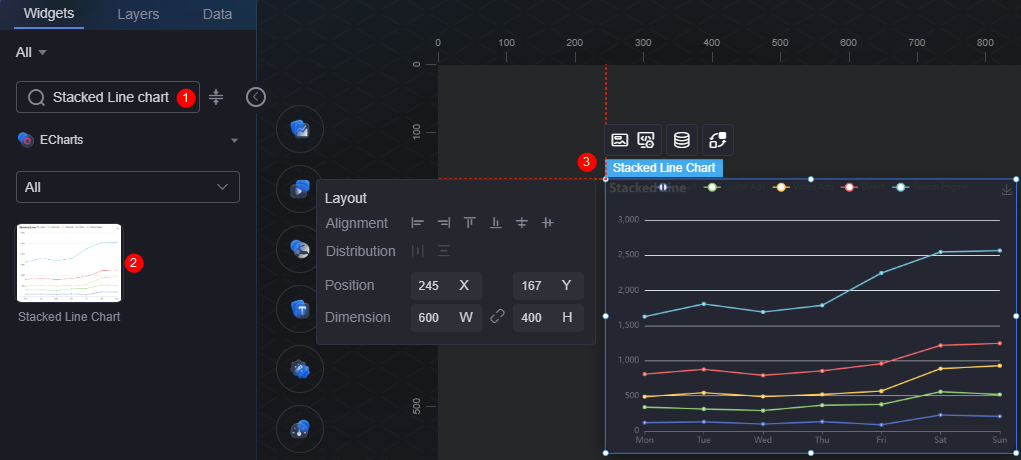
- On the large screen design page, drag a stacked line chart widget from the ECharts section to the canvas.
Figure 1 Dragging a stacked line chart widget to the canvas
- Select the stacked line chart widget and click
 .
. - In the Custom Events area, click Add Custom Events and change the event name to echartsclickseries.
Figure 2 Creating an echartsclickseries event
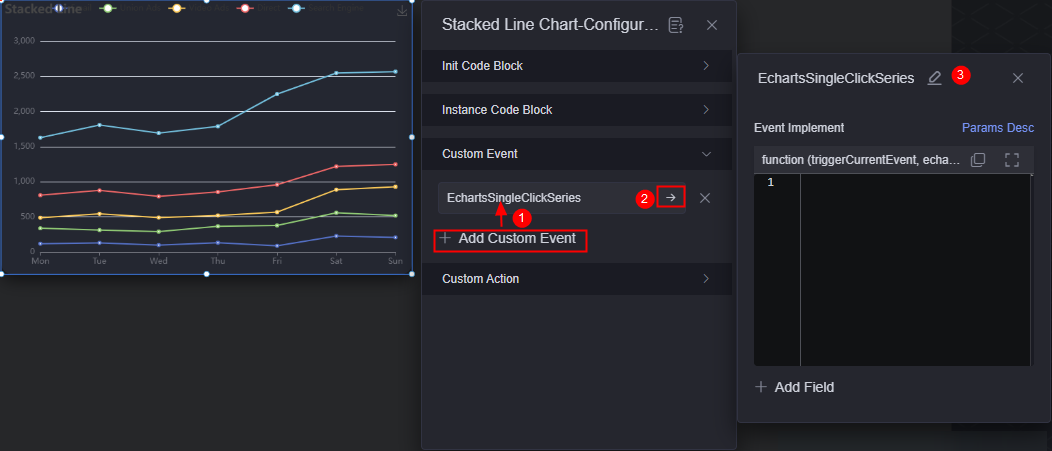
- In the event implementation, enter the following code. The ECharts instance will trigger this event on click and pass the event object as a parameter.
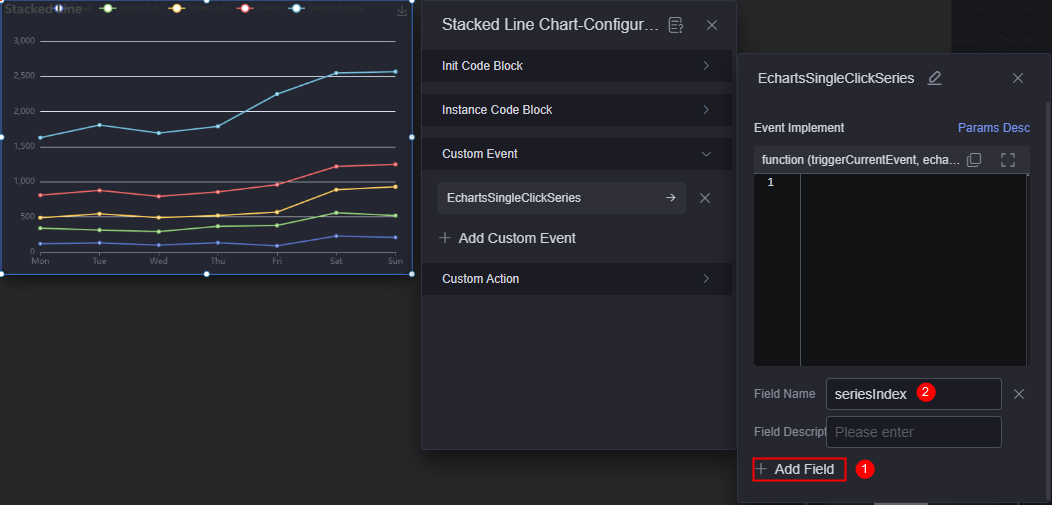
echartsInst.on('click', 'series', triggerCurrentEvent); - Click Add Field and set the field name to seriesIndex.
Figure 3 seriesIndex field
- Select the ECharts widget and click
 to access the widget interaction page.
 - Click Interaction Event and select echartsclickseries.
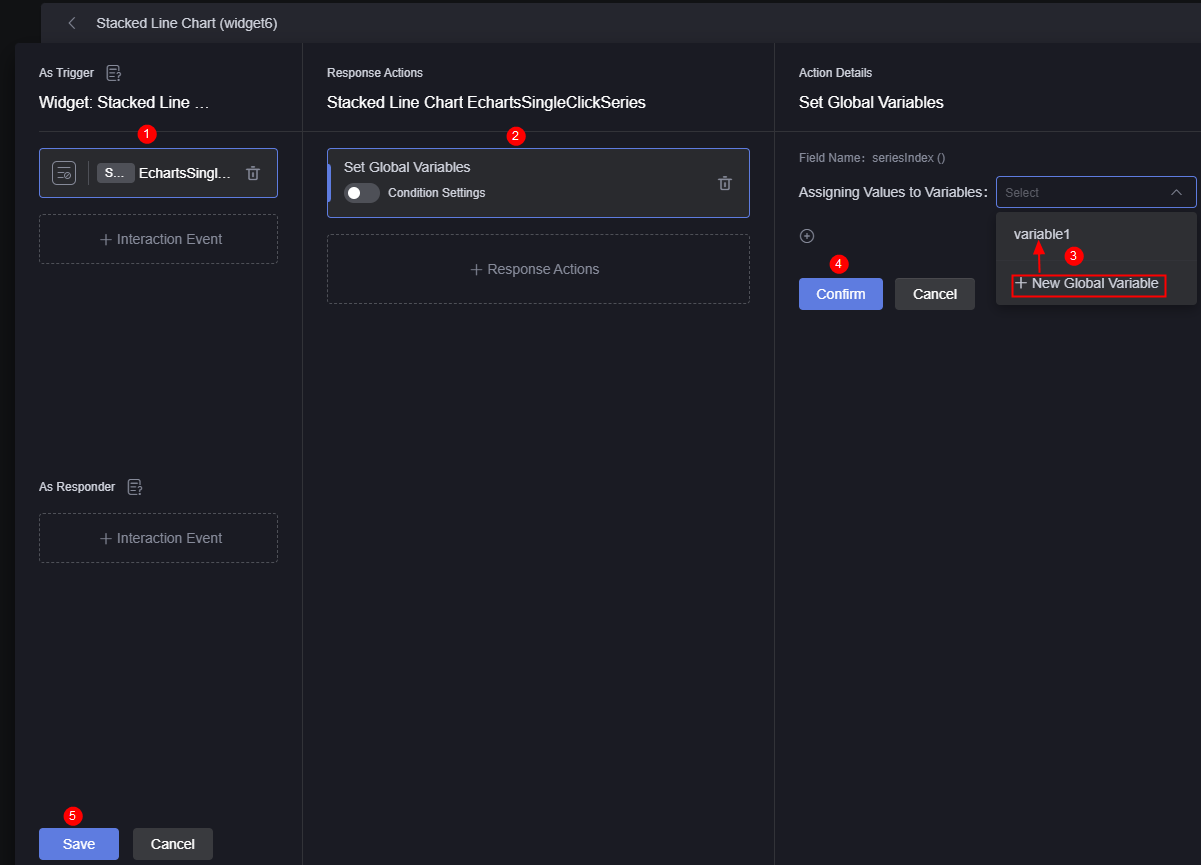
- Set the response action for the echartsclickseries event. For example, assign the seriesIndex field value to a global variable.
Figure 4 Assigning the value of seriesIndex to the global variable
- Click the finish button to return to the large screen design page.
- Drag a solid pie chart from All to the canvas.
- Sets data for a solid pie chart.
- Select the solid pie chart and click
 .
. - Select Dataset for Data Type and select the required dataset.
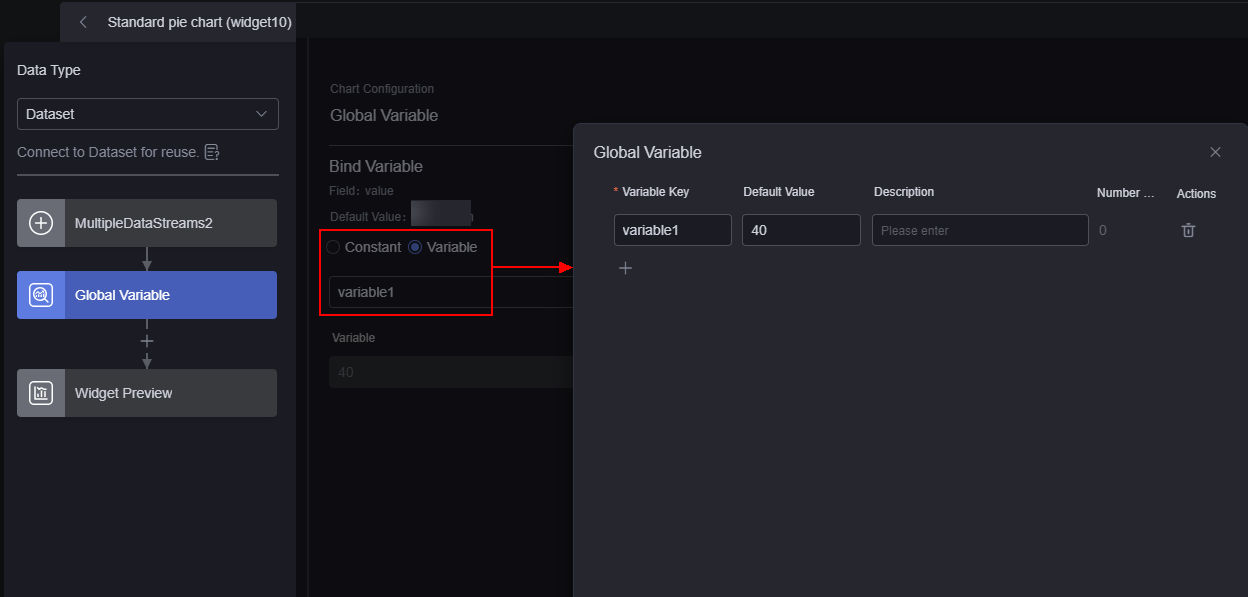
- In the global variable configuration, bind the global variables in 8 and assign values to the global variables.
Figure 5 Binding global variables
- In the widget preview area, drag the corresponding field from the table field to the configuration and click Save.
- Select the solid pie chart and click
- Return to the large screen design page, click
 , and click
  .
. - On the preview page, click a series in the stacked line chart chart. The global variable of the page is set to the value of seriesIndex.
Parent topic: Widget Management
Feedback
Was this page helpful?
Provide feedbackThank you very much for your feedback. We will continue working to improve the documentation.See the reply and handling status in My Cloud VOC.
The system is busy. Please try again later.
For any further questions, feel free to contact us through the chatbot.
Chatbot


