
ECharts
The platform integrates the ECharts chart library to enhance the capabilities of preset widgets. ECharts is one of the most widely used open source chart libraries.
ECharts widgets are currently available only for professional and enterprise instances.
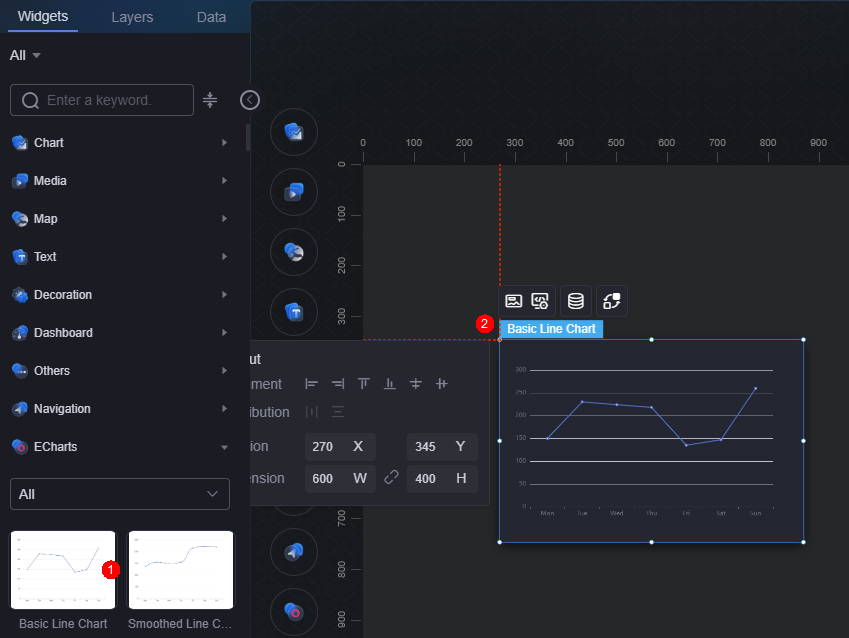
The basic line chart is used as an example. On the large screen design page, drag a basic line chart widget from All > ECharts to the blank area of the canvas, as shown in Figure 1.

Card
A card wraps a chart widget. A widget consists of card elements (card title, chart, card background, and card border) and chart elements.
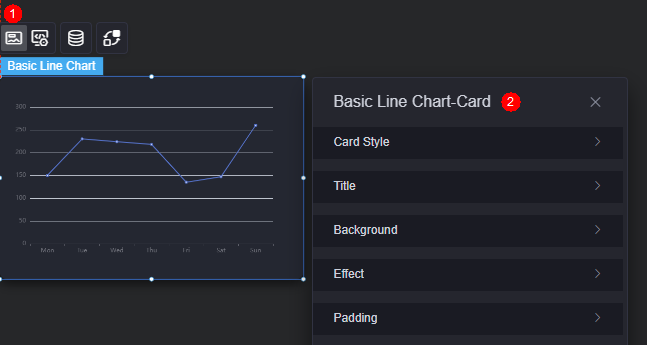
- Card style: You can select a card style based on your service requirements. You can click the clear style button to clear the configured style.
- Title
- Title: Whether to display the title.
- Content: Enter the title content.
- Font: Font, size, and color of the title.
- Alignment: The positioning of the title, such as left, right, or center alignment.
- Background color: Background color of the title.
- Background
- Background color: Background color of the widget card.
- Border: Border of the widget card. Options: no border, full border, and corner border. For full border and corner border, you can set the line type and rounded corners of the outer border of the widget.
- Style: Image display style. The options are normal, center, stretch, and tiled.
- Choose image: Use a local image as the widget background. Directories and subdirectories can be added to facilitate image management by category. JPG, JPEG, PNG, or GIF images are recommended. The size of each image cannot exceed 50 MB.
- Special effect: Widget highlighted status. Displayed by default or on page load.
- Padding: Distance between the chart and the four sides (top, bottom, left, and right) of the widget (see Figure 2). The default value is 0, indicating that the chart spreads across the widget.
ECharts Widget Settings
You can set the initialization code block, instance code block, custom event, and custom action of the ECharts widgets in configuration.
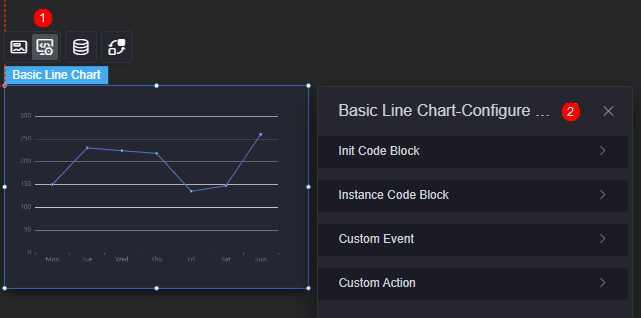
- Initialization code block: This text box is a JavaScript execution environment for creating an ECharts instance using the init method. It allows you to configure initialization settings, such as the ECharts theme.
Figure 5 Initialization code block
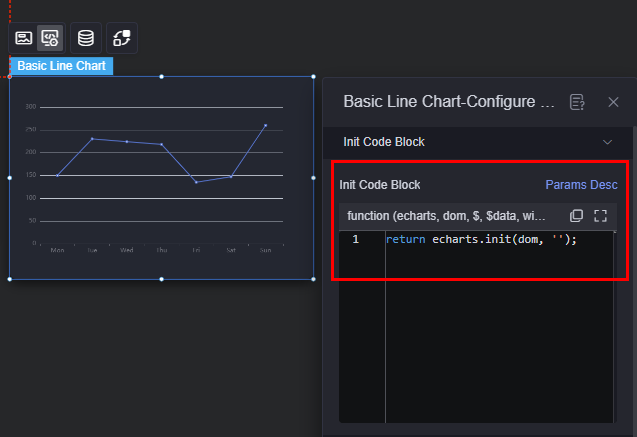
- Click the button to view the parameter description of the initialization code block.
- Click
 to copy the initialization code.
 - Click
 to maximize the initialization code block page.
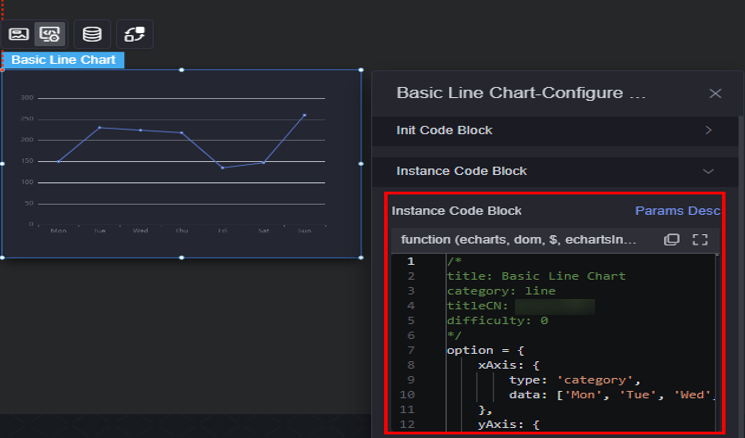
- Instance code block: Similar to the initialization code block, this block constructs the option object required by ECharts' setOption (automatically executed by the platform). The platform offers hundreds of ECharts widgets, each based on instance code derived from demo examples on the ECharts official website, for example, https://echarts.apache.org/examples/en/editor.html?c=line-simple.
Figure 6 Instance code block
- Click the button to view the parameter description of the instance code block.
- Click
 to copy the instance code.
 - Click
 to maximize the instance code block page.
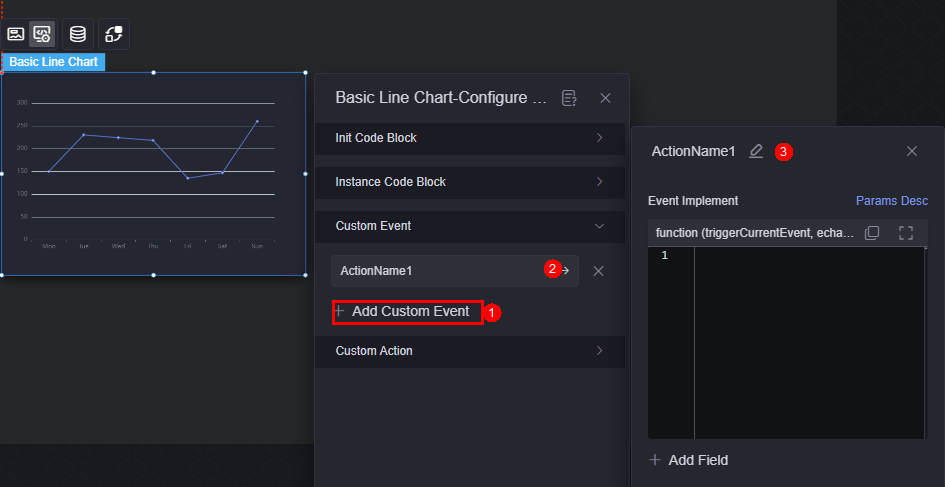
- Custom events: ECharts widgets support custom events and interactions to enhance their interactive capabilities within the system. Click the button to add a custom event. In the event implementation, you can edit the code to bind the triggerCurrentEvent method for sending events to the callback of an ECharts instance or widget instance. Click Add Field to define the parameters carried in the event to be sent. For details about how to add an interaction for a custom event, see Customizing Event Interactions for ECharts Widgets.
Figure 7 Custom event
- Custom actions: Echarts supports custom actions for events response. Click the button to add a custom action. In the action implementation, compile the execution logic for triggering the action. The input parameter echartsInst can use the ECharts APIs, and widgetInst can use the common APIs of the platform widgets. Click the button to add a parameter and define the input parameter for triggering an action. For details about how to add an interaction for a custom action, see Customizing Interactive Actions for ECharts Widgets.
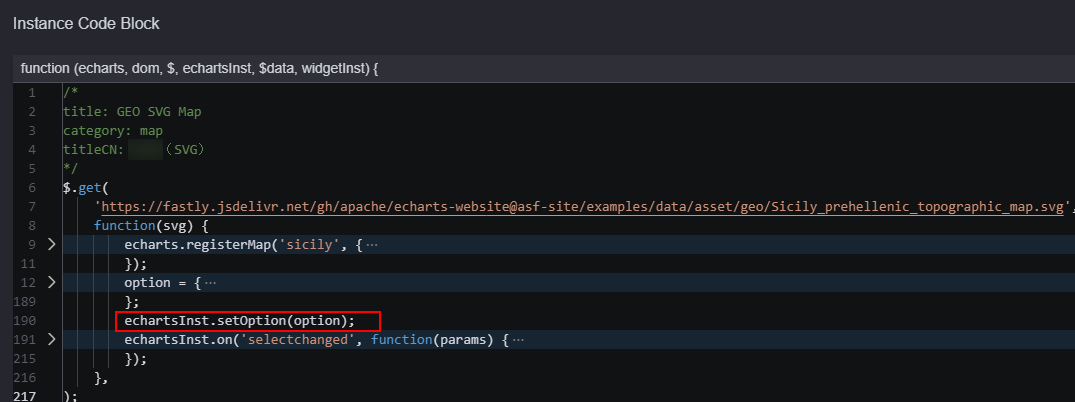
Asynchronous Loading
For some configuration items, files need to be loaded asynchronously before the Echarts is initialized. For example, you need to load the SVG file first for the map (SVG) widget. And you need to manually call setOption of ECharts in the callback function for completing the asynchronous loading action.
Data
On the data page, configure the data source of the ECharts widget. For details, see Data Access.
Different from other widgets, ECharts does not have field mapping in the data configuration process. Instead, it directly changes the content of the instance code block.
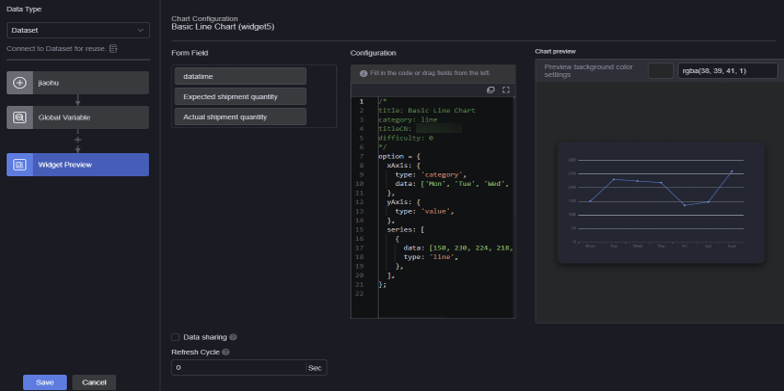
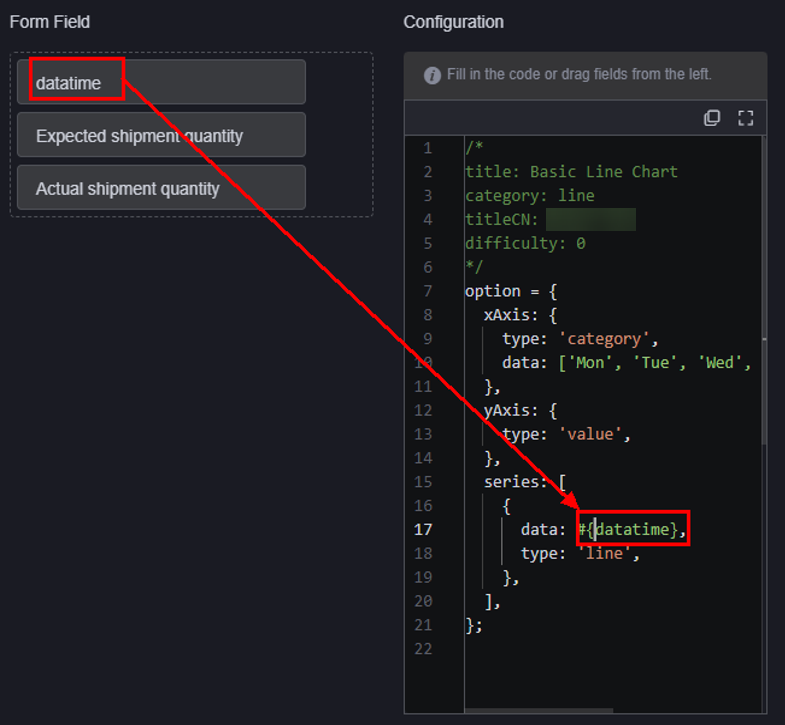
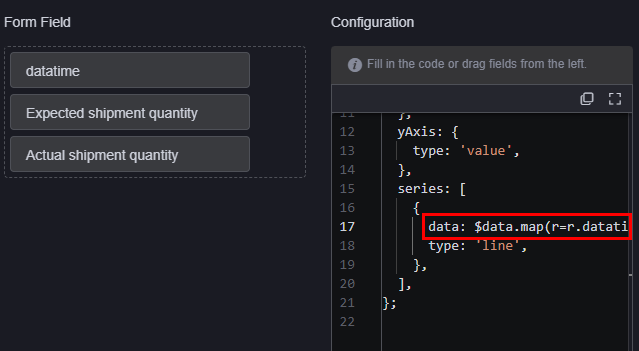
Drag the table fields on the left to the highlighted area of the code block in the configuration on the right, as shown in Figure 10. If the simple method of dragging columns cannot meet the requirements, you can use $data in the code to obtain the data configuration result and use JavaScript code to process the logic, as shown in Figure 11.
Interaction
In the interaction settings, you can configure interactions between the ECharts widget and other widgets or pages. For details, see Interaction Configuration. Different from other widgets, ECharts can be set in custom events and custom actions when it is used as an event of a trigger and an action of a responder. For details, see Customizing Event Interactions for ECharts Widgets and Customizing Interactive Actions for ECharts Widgets.
Feedback
Was this page helpful?
Provide feedbackThank you very much for your feedback. We will continue working to improve the documentation.See the reply and handling status in My Cloud VOC.
For any further questions, feel free to contact us through the chatbot.
Chatbot


