Overview
APM Agents periodically collect performance data of websites, including load performance, JS stability, API requests, access traffic, top 5 slowest pages, top 5 URLs with the most JS errors, top 5 slowest APIs, and top 5 URLs with the most visits. The Overview page displays metrics such as UV, PV, Avg. Load Time, JS Errors, Slow APIs, and API Success Rate.
Viewing Overall Metrics
- Log in to the APM console.
- Click
 on the left and choose Management & Governance > Application Performance Management.
 - In the navigation pane on the left, choose Web Monitoring > Overview.
Figure 1 Overview
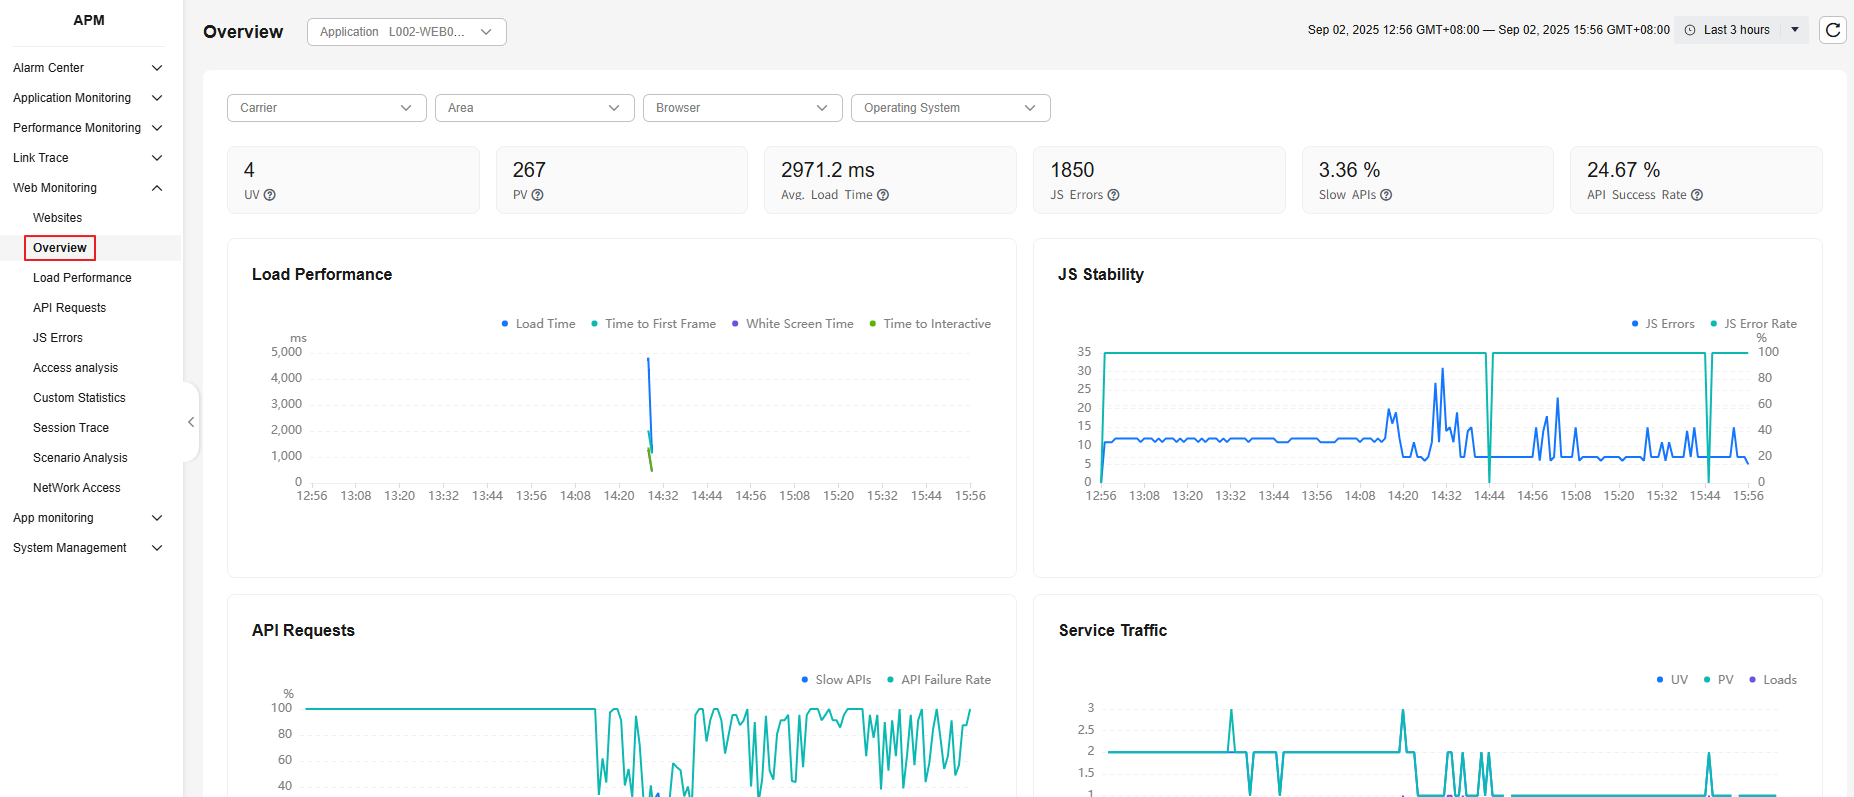
Table 1 Overview metrics Parameter
Description
UV
Number of visitors who access the website. If a user accesses the site multiple times in a day, only one UV will be counted.
PV
Page view (PV), which is the number of times a page is opened or refreshed.
Avg. Load Time
Average page load time.
JS Errors
JS error rate = Number of errors triggered during JS running/Total number of Java scripts
Slow APIs
Slow APIs refer to APIs with load time longer than 1,000 ms. Slow API proportion = Number of slow APIs/Total number of APIs
API Success Rate
API success rate = Number of APIs that are successfully called/Total number of APIs
- Perform other operations if needed.
- Select a site, carrier, region, browser, and OS from the drop-down lists to view required information.
- Select a time range. Default: Last 20 minutes.
Options: Last 20 minutes, Last hour, Last 3 hours, Last 6 hours, Last day, Today, Yesterday, Last week, Last month, or Custom.
Load Performance
- Click
 on the left and choose Management & Governance > Application Performance Management.
 - In the navigation pane, choose Web Monitoring > Overview.
- Move the cursor to the load performance graph. The detailed load performance data is displayed.
Figure 2 Load performance
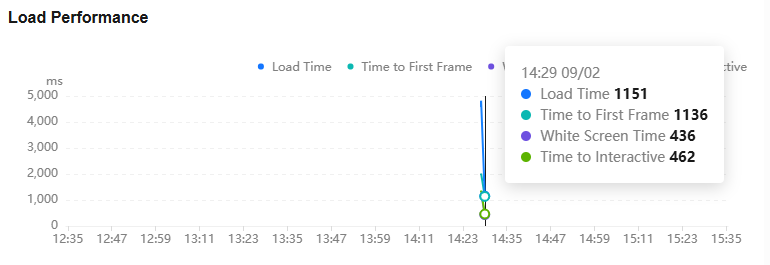
Table 2 Load performance parameters Parameter
Description
Load Time
Page load time.
First Contentful Paint (FCP)
Duration from the time when you open a website to the time when the content on the home page of the browser has been rendered.
First Paint (FP)
Duration from the time when you click a link or enter a URL to the time when the browser starts to display content.
Time to Interactive
Duration from the time when a page starts to be loaded to the time when main resources are rendered and a response is made.
- Move the cursor to the load performance graph. The detailed load performance data is displayed.
JS Stability
- In the navigation pane, choose Web Monitoring > Overview.
- Move the cursor to the JS stability trend graph. The detailed JS stability data is displayed.
Figure 3 JS stability
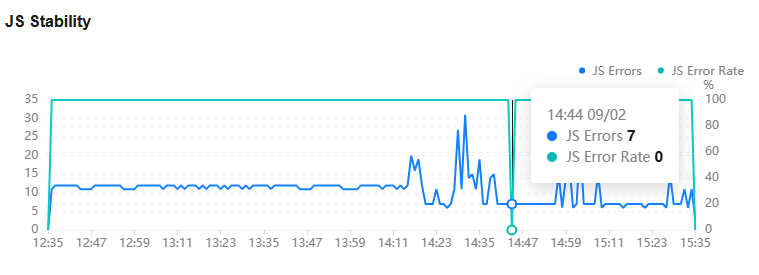
Table 3 JS stability parameters Parameter
Description
JS Errors
Number of JS errors.
JS Error Rate
JS error rate = Number of errors triggered during JS running/Total number of Java scripts
- Move the cursor to the JS stability trend graph. The detailed JS stability data is displayed.
API Requests
- In the navigation pane, choose Web Monitoring > Overview.
- Move the cursor to the API request trend graph. The detailed API request data is displayed.
Figure 4 API requests
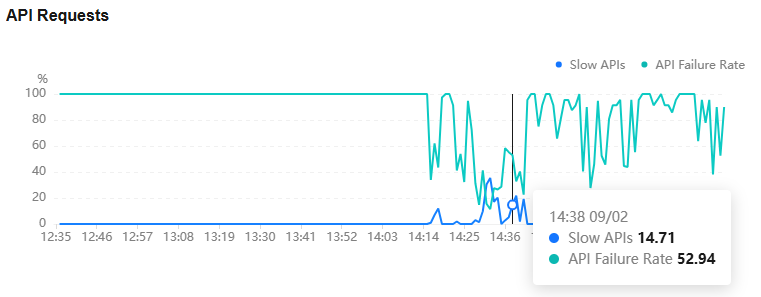
Table 4 API request parameters Parameter
Description
Slow APIs
Slow APIs refer to APIs with load time longer than 1,000 ms. Slow API proportion = Number of slow APIs/Total number of APIs
API Failure Rate
Probability that APIs fail to be called.
- Move the cursor to the API request trend graph. The detailed API request data is displayed.
Service Traffic
APM Agents regularly collect access traffic data of websites and HTML5 clients. The data includes UV, PV, and Loads.
- In the navigation pane, choose Web Monitoring > Overview. Move the cursor to the service traffic trend graph. The traffic data is displayed.
Figure 5 Service traffic
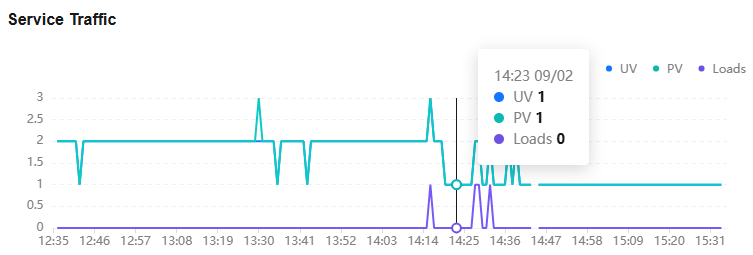
Table 5 Service traffic parameters Parameter
Description
UV
Number of visitors who access the website. If a user accesses the site multiple times in a day, only one UV will be counted.
PV
Page view (PV), which is the number of times a page is opened or refreshed.
Loads
Total number of times pages were loaded.
Top 5 Slowest Pages
This card displays the five URLs with the longest load time. The metrics include URL, Loads, and Avg. Load Time.
Top 5 JS Errors
This card displays the five URLs with the most JS errors. The metrics include URL, Error, and Number of errors.
Top 5 Slowest APIs
This card displays the top 5 slow APIs. The metrics include URL, Request Method, Number of Slow Requests, and Avg. Load Time.
- In the navigation pane, choose Web Monitoring > Overview. The Top 5 Slow APIs card is displayed.
- Click a URL in the URL column. The request statistics details of the URL are displayed. For details, see 4.
Top 5 Visits
This card displays five URLs with the most visits. The metrics include URL, Page View (PV), and Number of visitors (UV).
Feedback
Was this page helpful?
Provide feedbackThank you very much for your feedback. We will continue working to improve the documentation.See the reply and handling status in My Cloud VOC.
For any further questions, feel free to contact us through the chatbot.
Chatbot


