API Requests
The API Requests page displays the API failure rate trend, average call time trend, API request list, and status code distribution.
Procedure
- Log in to the APM console.
- Click
 on the left and choose Management & Governance > Application Performance Management.
 - In the navigation pane on the left, choose Web Monitoring > API Requests. The API request performance data is displayed.
- API Failure Rate Trend: displays the number of API calls, proportion of slow requests, and API failure rate. Move the cursor to the graph. The detailed metric data is displayed.
- Avg. Call Time Trend: displays the API call queuing time, connection time, time to first byte (TTFB), and download time. Move the cursor to the graph. The detailed metric data is displayed.
- API Request List: displays the API request links, total number of requests, average request duration, number of slow requests, proportion of slow requests, number of errors, and error rate.
- Enter API in the search box and click
 to view the API requests that meet the search criteria.
 - Click
 in the upper right corner of the list and select the target metric data.
 - By default, API requests are sorted by Total Requests in descending order.
- Enter API in the search box and click
- Status Code Distribution: displays API request status codes, number of requests with different status codes returned, and proportion of those requests. Move the cursor to the ring. The number of requests with a certain status code returned is displayed.
Click
 in the upper right corner of the list and select the target metric data.
- Drill down to the details of the API request list and status code distribution.
- Drill down to the details of the API request list.
- Click an API in the API Request List column. The total number of requests, number of errors, error rate, number of slow requests, proportion of slow requests, and average success call time are displayed.
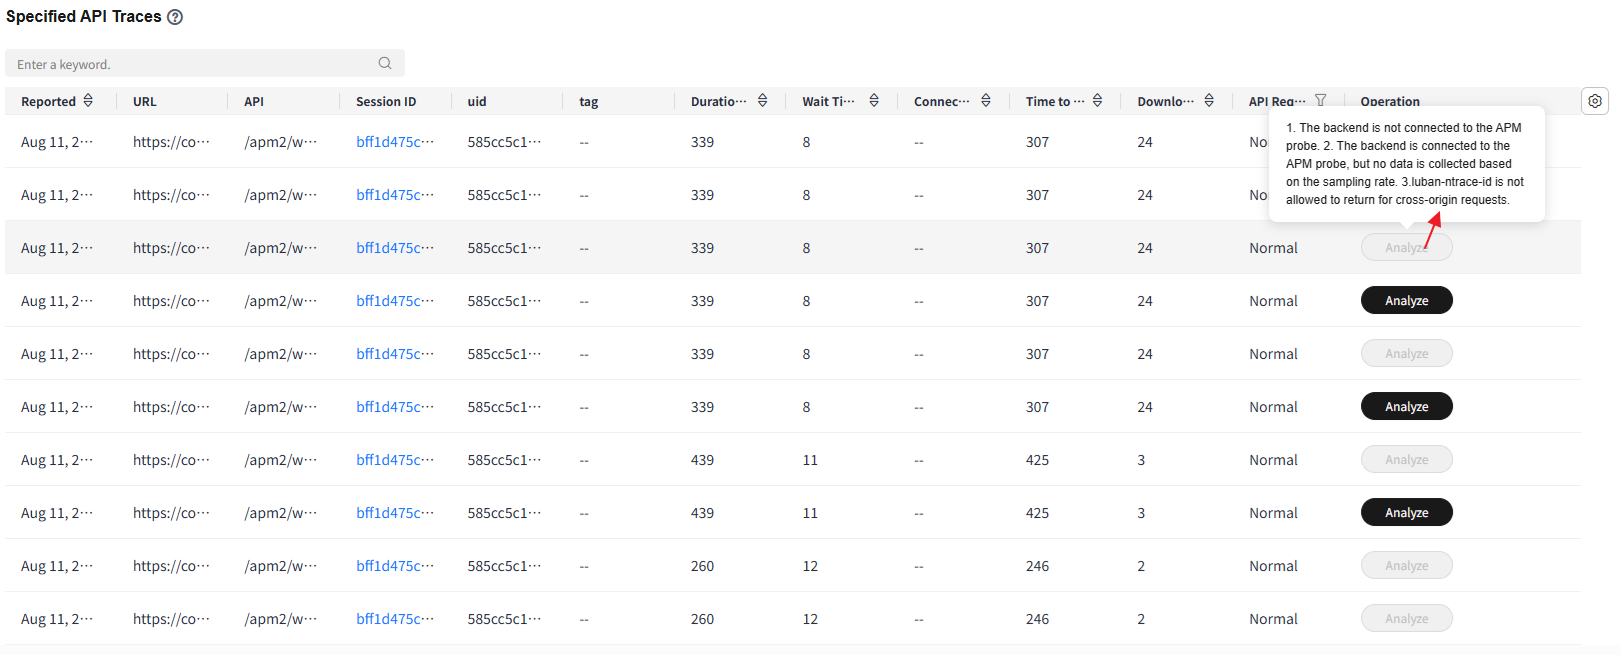
- Specified API Traces: displays specified API traces. The displayed metrics include the report time, URL, API, device ID, session ID, UID, tag, additional information, request time, wait time, connection time, time to first byte (TTFB), download time, API request status, status code, and backend information.
- Click
 in the upper right corner of the list and select the target metric data.
 - Enter the search criteria in the search box and click
 to view the traces that meet the search criteria.
 - By default, specified API traces are sorted by report time in descending order.
- In the specified API trace list, click a session ID in the Session ID column to go to the session tracing page.
- In the specified API trace list, click Analyze in the Operation column to go to the tracing page.
If the Analyze button is unavailable, move the cursor to it to check the possible causes.
Figure 1 Reason why no data is collected
- API Failure Rate Trend: displays the number of API calls and the API failure rate.
Table 1 API request parameters Parameter
Description
UV
Number of visitors who access the website. If a user accesses the site multiple times in a day, only one UV will be counted.
PV
Page view (PV), which is the number of times a page is opened or refreshed.
Avg. Load Time
Average page load time.
JS Errors
Number of JS errors.
Slow APIs
Slow APIs refer to APIs with load time longer than 1,000 ms. Slow API proportion = Number of slow APIs/Total number of APIs
API Success Rate
API success rate = Number of APIs that are successfully called/Total number of APIs
Queuing Time
API call queuing time, connection time, TTFB, and download time.
Connection Time
Connection time of an API call.
Time to First Byte
Duration from the time when a request is sent to the time when the first response byte is received.
Download Time
Download time of an API call.
API
API request link.
Total Requests
Total number of API requests.
Avg. Duration (ms)
Average API request duration.
Slow Requests
Number of slow API requests.
Slow Request Proportion
Proportion of slow API requests.
Errors
Number of API request errors.
Error Rate
Error rate of API requests.
Status Code
Status code that is returned when an API is called.
Requests with This Status Code
Proportion of API requests with a certain status code returned.
Avg. Success Call Time
Average time for calling an API.
Reported
Time when an API trace was reported.
URL
URL of an API trace.
Device ID
Device ID of an API trace.
Session ID
Session ID of an API trace.
Wait Time
Wait time of an API trace.
Connection Time
Connection time of an API trace.
API Request Status
Options: Normal, Slow, and Error.
UID
User ID of an API trace.
Tag
User tag of an API trace.
Duration (ms)
Request duration of an API trace.
Additional Information
Additional information of an API request.
Status Code
Status code corresponding to an API request.
Backend Information
Backend information of an API request.
- Click an API in the API Request List column. The total number of requests, number of errors, error rate, number of slow requests, proportion of slow requests, and average success call time are displayed.
- Drill down to the details about request status code distribution.
- Click a status code in the Status Code column. The metrics such as Total Requests, Errors, Error Rate, Slow Requests, Slow Request Proportion, and Avg. Success Call Time of the status code are displayed.
Table 2 Status code parameters Parameter
Description
Total Requests
Total number of API requests.
Errors
Number of API request errors.
Error Rate
Error rate of API requests.
Slow Requests
Number of slow API requests.
Slow Request Proportion
Proportion of slow API requests.
Avg. Success Call Time
Average time for calling an API.
- Specified API Traces: displays specified API traces. The displayed metrics include the report time, URL, API, device ID, session ID, UID, tag, additional information, request time, wait time, connection time, time to first byte (TTFB), download time, API request status, status code, and backend information.
- Click
 in the upper right corner of the list and select the target metric data.
 - Enter the search criteria in the search box and click
 to view the traces that meet the search criteria.
 - By default, specified API traces are sorted by report time in descending order.
- In the specified API trace list, click a session ID in the Session ID column to go to the session tracing page.
- In the specified API trace list, click Analyze in the Operation column to go to the tracing page.
If the Analyze button is unavailable, move the cursor to it to check the possible causes.
Figure 2 Reason why no data is collected
- API summary list
- Click an API in the API column. The metrics such as the report time, URL, API, device ID, session ID, UID, tag, additional information, duration, wait time, connection time, time to first byte (TTFB), download time, API request status, status code, and backend information are displayed.
Table 3 Parameters about a specified API trace Parameter
Description
Reported
Time when an API trace was reported.
URL
API trace URL.
API
API request link.
Device ID
Device ID of an API trace.
Session ID
Session ID of an API trace.
UID
User ID of an API trace.
Tag
User tag of an API trace.
Additional Information
Additional information of an API request.
Duration (ms)
Request duration of an API trace.
Wait Time
Wait time of an API trace.
Connection Time
Connection time of an API trace.
Time to First Byte
Duration from the time when a request is sent to the time when the first response byte is received.
Download Time
Download time of an API call.
API Request Status
Options: Normal, Slow, and Error.
Status Code
Status code corresponding to an API request.
Backend Information
Backend information of an API request.
- On the Request Statistics xxx; Status Code xxx page, click Analyze in the Operation column to go to the tracing page.
If the Analyze button is unavailable, move the cursor to it to check the possible causes.
- Click an API in the API column. The metrics such as the report time, URL, API, device ID, session ID, UID, tag, additional information, duration, wait time, connection time, time to first byte (TTFB), download time, API request status, status code, and backend information are displayed.
- Click a status code in the Status Code column. The metrics such as Total Requests, Errors, Error Rate, Slow Requests, Slow Request Proportion, and Avg. Success Call Time of the status code are displayed.
- Drill down to the details of the API request list.
Feedback
Was this page helpful?
Provide feedbackThank you very much for your feedback. We will continue working to improve the documentation.See the reply and handling status in My Cloud VOC.
For any further questions, feel free to contact us through the chatbot.
Chatbot


