Load Performance
The Load Performance page displays page performance metrics. It includes Page Performance and Feature Statistics.
Page Performance: displays page load performance trends from multiple dimensions.
Detailed Analysis: displays page performance and resource loading metrics from multiple dimensions, and provides detailed analysis on the metrics or samples.
For mini programs such as WeChat, Baidu, Alipay, and DingTalk, some resource loading metrics (including Resource Loading Times, Resource Loading Success Rate, Average Resource Loading Time, Static Resource Loading Times, Avg. Time for Static Resource Loading, Dynamic Resource Loading Times, and Avg. Time for Dynamic Resource Loading) are not supported.
Procedure
- Log in to the APM console.
- Click
 on the left and choose Management & Governance > Application Performance Management.
 - In the navigation pane on the left, choose Web Monitoring > Load Performance. The Load Performance page is displayed by default.
- Select a site, carrier, region, browser, and OS from the drop-down lists to view required information.
- Displays the average loading time, P75 Largest Contentful Paint (LCP), number of JS errors, percentage of slow APIs, API success rate, number of resource loading times, resource loading success rate, average resource loading time, number of static resource loading times, average time for static resource loading, number of dynamic resource loading times, and average time for dynamic resource loading.
- Page Performance: displays the access speed metric trend, performance trend, performance sample distribution, loading times, loading time, and loading status.
- Detailed Analysis: displays the URLs for page performance analysis and resources that have been loaded.
-
Table 1 Load performance parameters Parameter
Description
Avg. Load Time
Average page load time.
P75 Largest Contentful Paint (LCP)
LCP reports the render time of the largest image or text block visible in the viewport, relative to when the user first navigated to the page. The 75th percentile LCP is used here.
JS Errors
Number of JS errors.
Slow APIs
Slow APIs refer to APIs with load time longer than 1,000 ms. Slow API proportion = Number of slow APIs/Total number of APIs
API Success Rate
API success rate = Number of APIs that are successfully called/Total number of APIs
Resource Loading Times
Total number of static and dynamic resource loading times.
Resource Loading Success Rate
Success rate of dynamic and static resource loading.
Average Resource Loading Time
Average loading duration of static and dynamic resources.
Static Resource Loading Times
Number of times static resources are loaded.
Avg. Time for Static Resource Loading
Average time for static resource loading.
Dynamic Resource Loading Times
Number of times dynamic resources are loaded.
Avg. Time for Dynamic Resource Loading
Average time for dynamic resource loading.
- In the upper right corner of the Load Performance page, select a time range. Default: Last 20 minutes.
Options: Last 20 minutes, Last hour, Last 3 hours, Last 6 hours, Last day, Today, Yesterday, Last week, Last month, or Custom.
Page Performance
- Access speed metrics
Displays the number of load times, average load time, First Contentful Paint (FCP), First Paint (FP), Time to Interactive (TTI), Cumulative Layout Shift (CLS), Interaction to Next Paint (INP), and average Largest Contentful Paint (LCP).
Table 2 Access speed metrics Parameter
Description
Load Times
Number of times the page was loaded.
Avg. Load Time
Average page load time. Duration from the time when you open a website to the time when the content on the home page of the browser has been rendered.
First Contentful Paint (FCP)
Duration for the first content (such as the text, image, or canvas) to be rendered on the page.
First Paint (FP)
Duration for the first pixel to be rendered on the page. This occurs when the HTML parsing is completed or partially completed.
Time to Interactive (TTI)
Duration from the time when a page starts to be loaded to the time when main resources are rendered and a response is made.
Cumulative Layout Shift (CLS)
CLS measures the scores for every unexpected layout shift that occurs during the entire lifecycle of a page and add them together.
Interaction to Next Paint (INP)
INP measures how responsive a page is to visitor interactions. It measures the elapsed time between a click or a keypress. (This option is disabled by default. You can configure it by setting enableInp in initialization parameters.)
Avg. Largest Contentful Paint (LCP)
LCP reports the render time of the largest image or text block visible in the viewport, relative to when the user first navigated to the page. The average LCP is used here.
- Click the colored circle next to each metric. When the cursor is hovered over a circle, the corresponding metric will be highlighted. If a circle is gray, the corresponding metric will not be displayed in the trend graph. If a circle is colored, the corresponding metric will be displayed in the trend graph.
- Move the cursor to the graph. The detailed metric information is displayed.
- Performance trend
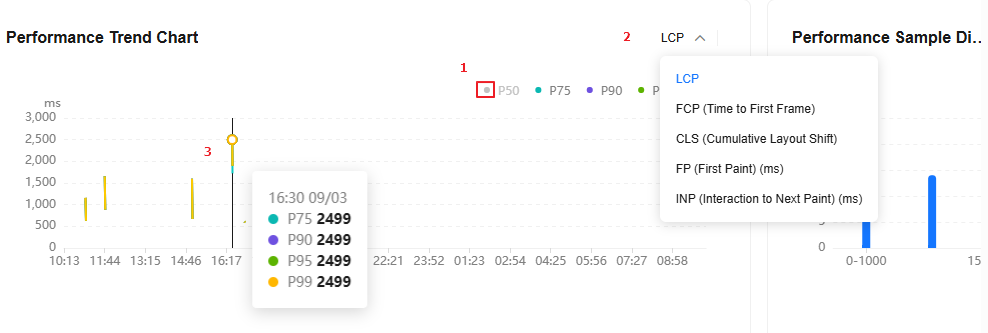
Displays the P50, P75, P90, P95, and P99 values of a metric at different time.
- 1 in Figure 1: Click the colored circle next to each metric. When the cursor is hovered over a circle, the corresponding metric will be highlighted. If a circle is gray, the corresponding metric will not be displayed in the trend graph. If a circle is colored, the corresponding metric will be displayed in the trend graph.
- 2 in Figure 1: Select a metric from the drop-down list. Options: Largest Contentful Paint (LCP), First Contentful Paint (FCP), Cumulative Layout Shift (CLS), First Paint (FP), and Interaction to Next Paint (INP).
- 3 in Figure 1: Move the cursor to the graph. The detailed metric data is displayed.
- Performance sample distribution
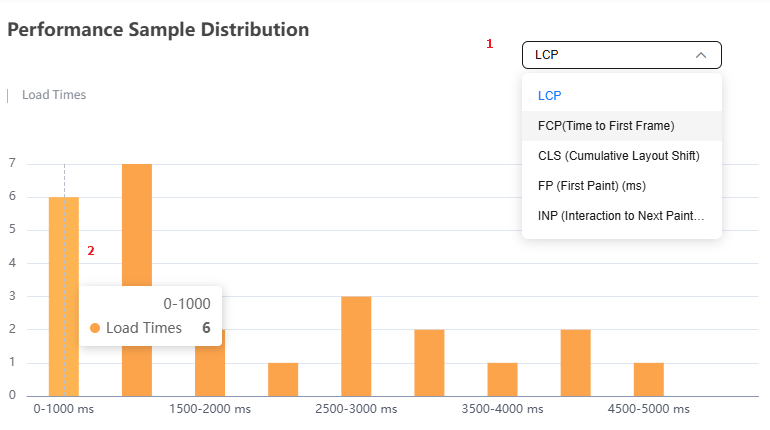
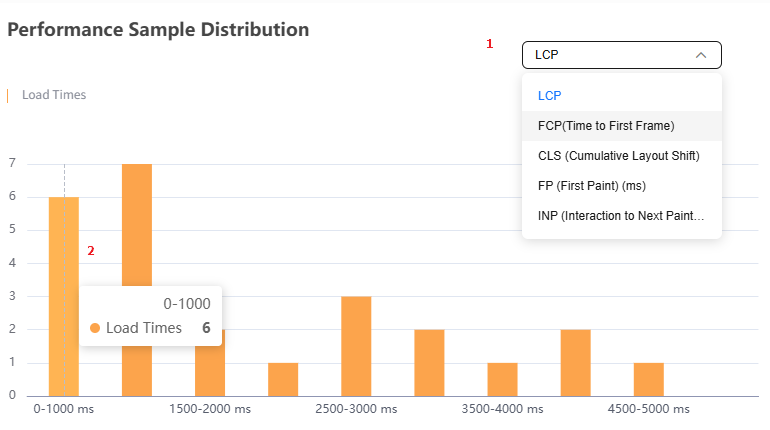
Displays the number of load times at different time. Move the cursor to the graph. The detailed metric information is displayed.
- 1 in Figure 2: Select a metric from the drop-down list. Options: Largest Contentful Paint (LCP), First Contentful Paint (FCP), Cumulative Layout Shift (CLS), First Paint (FP), and Interaction to Next Paint (INP).
As shown in Figure 2, there are two loads when LCP is in the range of 2500–3000 ms.
- 2 in Figure 2: Move the cursor to the graph. The detailed metric data is displayed.
- 1 in Figure 2: Select a metric from the drop-down list. Options: Largest Contentful Paint (LCP), First Contentful Paint (FCP), Cumulative Layout Shift (CLS), First Paint (FP), and Interaction to Next Paint (INP).
- Load times
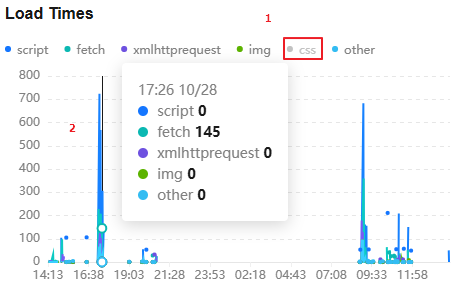
Displays the trends of script, fetch, xmlhttprequest, img, and other at a certain time point.
- 1 in Figure 3: Click the colored circle next to each metric. When the cursor is hovered over a circle, the corresponding metric will be highlighted. If a circle is gray, the corresponding metric will not be displayed in the trend graph. If a circle is colored, the corresponding metric will be displayed in the trend graph.
- 2 in Figure 3: Move the cursor to the graph. The detailed metric data is displayed.
- Loading time
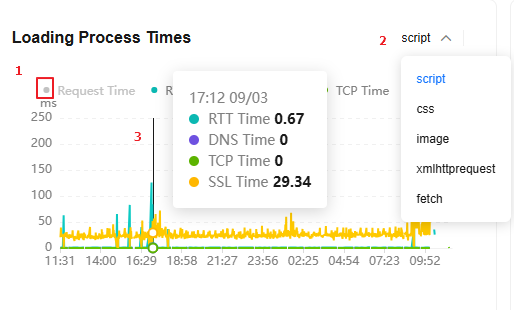
Displays the RTT, DNS, TCP, and SSL time at a certain time point.
- 1 in Figure 4: Click the colored circle next to each metric. When the cursor is hovered over a circle, the corresponding metric will be highlighted. If a circle is gray, the corresponding metric will not be displayed in the trend graph. If a circle is colored, the corresponding metric will be displayed in the trend graph.
- 2 in Figure 4: Select a metric from the drop-down list, such as script, fetch, xmlhttprequest, img, or other.
- 3 in Figure 4: Move the cursor to the graph. The detailed metric data is displayed.
- Loading status
Displays the failure rate, error count, and slow rate of a metric a certain time point.
- 1 in Figure 5: Click the colored circle next to each metric. When the cursor is hovered over a circle, the corresponding metric will be highlighted. If a circle is gray, the corresponding metric will not be displayed in the trend graph. If a circle is colored, the corresponding metric will be displayed in the trend graph.
- 2 in Figure 5: Select a metric from the drop-down list, such as script, fetch, xmlhttprequest, img, or other.
- 3 in Figure 5: Move the cursor to the graph. The detailed metric data is displayed.
Detailed Analysis
The Detailed Analysis page displays the URLs for page performance analysis and resources that have been loaded.
- In the navigation pane, choose Web Monitoring > Load Performance. Scroll down the page. The Detailed Analysis tab page is displayed by default.
- Page performance analysis
Displays performance analysis details of pages. The metrics include Page URL, Load Times, P75 Largest Contentful Paint (LCP), Avg. Largest Contentful Paint (LCP), P75 Largest Contentful Paint (LCP) (Pre-rendering Included), Avg. Largest Contentful Paint (LCP) (Pre-rendering Included), Avg. Load Time, First Contentful Paint (FCP), First Paint (FP), Time to Interactive (TTI), Cumulative Layout Shift (CLS), and Interaction to Next Paint (INP).
- Enter the search criteria in the search box and click
 to view the page performance analysis list that meets the search criteria.
 - Click
 in the upper right corner of the page performance analysis list and select the target metric data.
 - By default, the page performance analysis list is sorted by Load Times in descending order.
- Click a URL in the Page URL column under Page Performance Analysis to view the load performance metrics of the URL.
Table 3 Load performance parameters Parameter
Description
Load Times
Number of times the page was loaded.
Avg. Load Time
Average page load time. Duration from the time when you open a website to the time when the content on the home page of the browser has been rendered.
First Contentful Paint (FCP)
Duration for the first content (such as the text, image, or canvas) to be rendered on the page.
First Paint (FP)
Duration for the first pixel to be rendered on the page. This occurs when the HTML parsing is completed or partially completed.
Time to Interactive (TTI)
Duration from the time when a page starts to be loaded to the time when main resources are rendered and a response is made.
First Meaningful Paint (FMP)
Duration from the time when the browser responds to the website address you entered to the time when the browser renders meaningful content.
P75 Largest Contentful Paint (LCP)
LCP reports the render time of the largest image or text block visible in the viewport, relative to when the user first navigated to the page. The 75th percentile LCP is used here.
Images
Number of images displayed on the page.
First Load APIs
Number of first load APIs.
APIs
Number of APIs for accessing a page.
Static Resources
Number of resources that are directly displayed on a fixed web page without database queries or program processing.
Size of First-Loaded Resources
Size of the resource loaded for the first time.
JS Error Rate
JS error rate = Number of errors triggered during JS running/Total number of Java scripts
Resource Load Time
Time consumed by loading resources.
Network Time
Time consumed in network communication.
- Page access speed metrics
Displays the number of load times, average load time, First Contentful Paint (FCP), First Paint (FP), Time to Interactive (TTI), Cumulative Layout Shift (CLS), Interaction to Next Paint (INP), and average Largest Contentful Paint (LCP) of a URL. For details about the parameters, see Table 2.
- Click the colored circle next to each metric. When the cursor is hovered over a circle, the corresponding metric will be highlighted. If a circle is gray, the corresponding metric will not be displayed in the trend graph. If a circle is colored, the corresponding metric will be displayed in the trend graph.
- Move the cursor to the graph. The detailed metric information is displayed.
- Performance trend
Displays the P50, P75, P90, P95, and P99 values of a metric at different time.
- 1 in the preceding figure: Click the colored circle next to each metric. When the cursor is hovered over a circle, the corresponding metric will be highlighted. If a circle is gray, the corresponding metric will not be displayed in the trend graph. If a circle is colored, the corresponding metric will be displayed in the trend graph.
- 2 in the preceding figure: Select a metric from the drop-down list. Options: Largest Contentful Paint (LCP), First Contentful Paint (FCP), Cumulative Layout Shift (CLS), First Paint (FP), and Interaction to Next Paint (INP).
- 3 in the preceding figure: Move the cursor to the graph. The detailed metric data is displayed.
- Performance sample distribution
Displays the number of load times at different time. Move the cursor to the graph. The detailed metric information is displayed.
- 1 in Figure 6: Select a metric from the drop-down list. Options: Largest Contentful Paint (LCP), First Contentful Paint (FCP), Cumulative Layout Shift (CLS), First Paint (FP), and Interaction to Next Paint (INP).
As shown in Figure 6, there are six loads when LCP is in the range of 0–1,000s.
- 2 in Figure 6: Move the cursor to the graph. The detailed metric data is displayed.
- 1 in Figure 6: Select a metric from the drop-down list. Options: Largest Contentful Paint (LCP), First Contentful Paint (FCP), Cumulative Layout Shift (CLS), First Paint (FP), and Interaction to Next Paint (INP).
- Page resource load time
Displays Resource Load Time, Static Resources, APIs, and Static Resource Size of a URL.
Table 4 Parameters related to the page resource load time Parameter
Description
Resource Load Time
Time consumed by loading resources.
Static Resources
Number of resources that are directly displayed on a fixed web page without database queries or program processing.
APIs
Number of APIs for accessing a page.
Static Resource Size
Size of resources that are directly displayed on a fixed web page without database queries or program processing.
- Loading performance distribution
Displays the number of URL loads in different load time ranges. Move the cursor to the graph. The detailed metric information is displayed.
- Page loading
The page loading time consists of network time, DOM parsing time, and resource loading time. For the network connection details, see the waterfall graph.
Table 5 Parameters related to the page load time Parameter
Description
DNS Lookup
Time spent on DNS lookup for the page.
TCP Connection
Time required for connecting to the server, including the SSL handshake, SSL connection, and TCP three-way handshake time.
SSL Connection
Time required for establishing an SSL connection. HTTPS requests involve such time. It is included in the TCP connection time.
Time to First Byte
Time from when the request is sent to when the first byte is received.
Content Transmission
Time taken by the browser to receive the server's response.
Network Time
Time taken from the time when a user sends a page request to the time when the browser receives a server response, involving DNS lookup, TCP connection, request response, and network transmission events.
DOM Parsing
Time taken to draw the DOM structure tree during DOM parsing.
Resource Loading
Time required for document, HTML, and JS parsing, and resource (such as CSS and image) loading.
- Single page access performance
- Go to the Single Page Access Performance area at the bottom of the page and click Details.
By default, the single page access performance analysis list is sorted by access time in descending order.
- On the displayed details page, view the page performance details. There are three modules on this page: performance metrics, page load exploded view, and resource loading analysis.
- Performance Metrics
- Page Load Exploded View: displays the total time required for page loading. For details, see Table 5.
- Resource Loading Analysis: displays resource loading information. Different resource types are in different colors. The length of a bar indicates the time taken to load resources. You can hover the cursor over a bar to view the loading time details or click the tab in the upper right corner to filter data by type.
- Go to the Single Page Access Performance area at the bottom of the page and click Details.
- Page access speed metrics
- Click View under APIs. Total Requests, Errors, Error Rate, Slow Requests, Slow Request Proportion, Avg. Success Call Time, Specified API Traces, API Summary, and Status Code Summary are displayed.
Table 6 URL parameters Parameter
Description
Total Requests
Total number of API requests.
Errors
Number of API request errors.
Error Rate
Error rate of API requests.
Slow Requests
Number of slow API requests.
Slow Request Proportion
Proportion of slow API requests.
Avg. Success Call Time
Average time for calling an API.
- Specified API traces: Displays metrics such as the reporting time, URL, API, device ID, session ID, UID, tag, additional information, request time, wait time, connection time, time to first byte, download time, API request status, status code, and backend information. For details, see step 4.
- API summary: Displays the API, total number of requests, and proportion of requests. For details, see the API summary list.
- Status code summary: Displays the status code, total number of requests, and proportion of requests. For details, see Request Status Code Distribution Details.
- Enter the search criteria in the search box and click
- Resource loading
Displays resource loading details, including the resource name, resource type, number of requests, average duration (ms), failure rate (%), slow requests, and slow request rate (%).
- Enter the search criteria in the search box above the loaded resource list and click
 to view the resources that meet the search criteria.
 - Click
 in the upper right corner of the resource loading list and select the target metric data.
 - By default, the resources are sorted by Solicited in descending order.
- The resource loading list supports detailed information drilldown.
- Click a resource name in the list. The number of loading times, average loading time, resource request failure rate, data volume, TCP time, SSL time, and DNS time of the resource are displayed.
Loading Status: When you move the cursor to the loading status graph, the slow request latency, slow request rate, error request latency, and error request rate at the current time are displayed.
Request Latency: When you move the cursor to the request latency graph, the average request time, average RTT, average DNS time, average TCP time, and average SSL time at the current time are displayed.
Loading Status Code: When you move the cursor to the loading status code graph, the proportion of each status code at the current time is displayed.
Geographical Distribution: When you move the cursor to the geographical distribution graph, the proportion of each region at the current time is displayed.
Browser Distribution: When you move the cursor to the browser distribution graph, the proportion of each browser at the current time is displayed.
System Distribution: When you move the cursor to the system distribution graph, the proportion of each system at the current time is displayed.
ISP Distribution: When you move the cursor to the ISP distribution graph, the proportion of each ISP at the current time is displayed.
List: displays network resource details of pages, including the visit time, status code, average request time, average RTT, average DNS time, average TCP time, average SSL time, and session ID.
- Click a visit time record in the Visit Time column. The access data corresponding to the visit time is displayed.
- Loading Information: displays the loading information at the current time, including the load time, size of static resources, status code, request response (TTFB), content transfer time, TCP time, SSL time, and DNS time.
- Access Information: displays the access information at the current time, including the accessed page and access time.
- Access User: displays the information about the access user at the current time, including the user ID, region, browser, resolution, IP address, OS, carrier, and session ID.
Click Session ID. The session tracing page is displayed, showing the detailed information about the user track. For details about session tracing, see Session Tracing.
- Page Load Breakdown Chart: displays the page loading information at the current time. It shows the DNS query, TCP connection, SSL connection establishment, content transfer time, and content transfer at a certain time point. Content transfer includes the start time, end time, and duration.
- Click a resource name in the list. The number of loading times, average loading time, resource request failure rate, data volume, TCP time, SSL time, and DNS time of the resource are displayed.
- Enter the search criteria in the search box above the loaded resource list and click
- Page performance analysis
Feedback
Was this page helpful?
Provide feedbackThank you very much for your feedback. We will continue working to improve the documentation.See the reply and handling status in My Cloud VOC.
For any further questions, feel free to contact us through the chatbot.
Chatbot

