Online Debugging
Overview
After the product model and codec are developed, the application can receive data reported by the device and deliver commands to the device through the platform.
IoTDA provides application and device simulators for you to commission data reporting and command delivery before developing real applications and physical devices. You can also use the application simulator to verify the service flow after the physical device is developed.
Debugging a Product by Using a Virtual Device
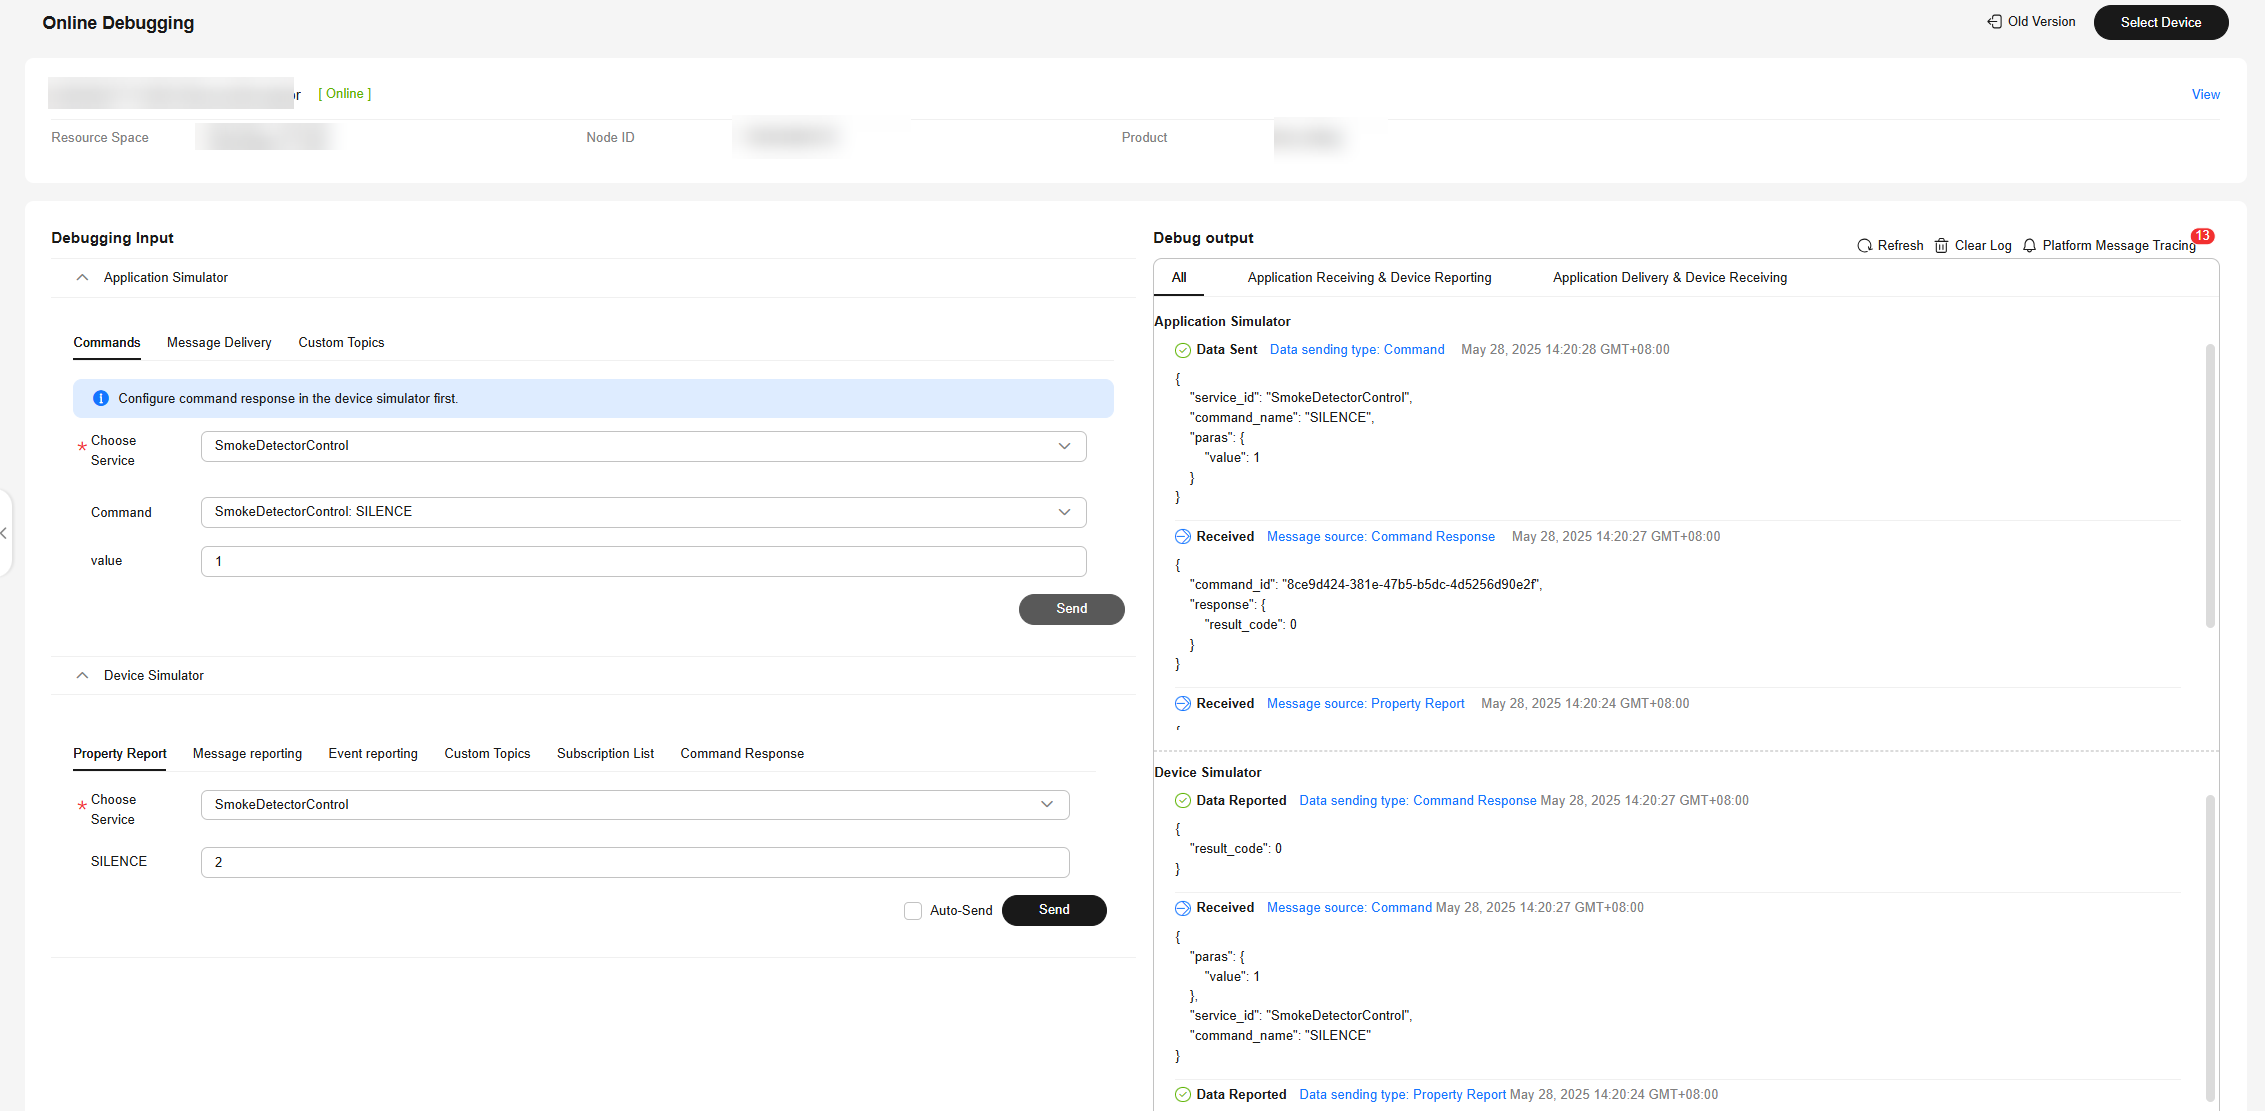
When both device development and application development are not completed, you can create virtual devices and use the application simulator and device simulator to test product models and codecs. The online debugging page consists of the following parts:
- Device information area (upper part): displays the basic information about the device that is being debugged, including the device name, device status, device ID, resource space, and product.
- Application simulator area (upper left corner): You can simulate an application to deliver commands, messages, and messages with custom topics.
- Device simulator area (lower left corner): You can simulate a device to report properties, messages, events, and messages with custom topics, and set command responses.
- Application simulator record area (upper right corner): displays the data received and delivered by the application.
- Device simulator record area (lower right corner): displays the data reported and received by the device.

To debug a virtual device online, perform the following steps:
- On the product details page, click the Online Debugging tab and click Add Test Device.
- In the Add Test Device dialog box, select Virtual device for Device Type and click OK. The virtual device name contains DeviceSimulator. Only one virtual device can be created for each product.
- In the device list, select the new virtual device. Figure 2 Online debugging - Creating a virtual device

- Click Debug on the right. Figure 3 Entering debugging

- On the displayed page, the device status is Online. Figure 4 Online Commissioning - Online devices

- In the Device Simulator area, select the usage scenario as required. Options: property reporting, message reporting, event reporting, and data reporting via custom topics. For example, to report a property, click the property reporting tab, select the target service, enter the property value, and click Send. Check the reported properties in the device simulator record area on the right. Check the property values received by the application simulator in the application simulator record area. Figure 5 Online debugging - Simulating data reporting (Battery)

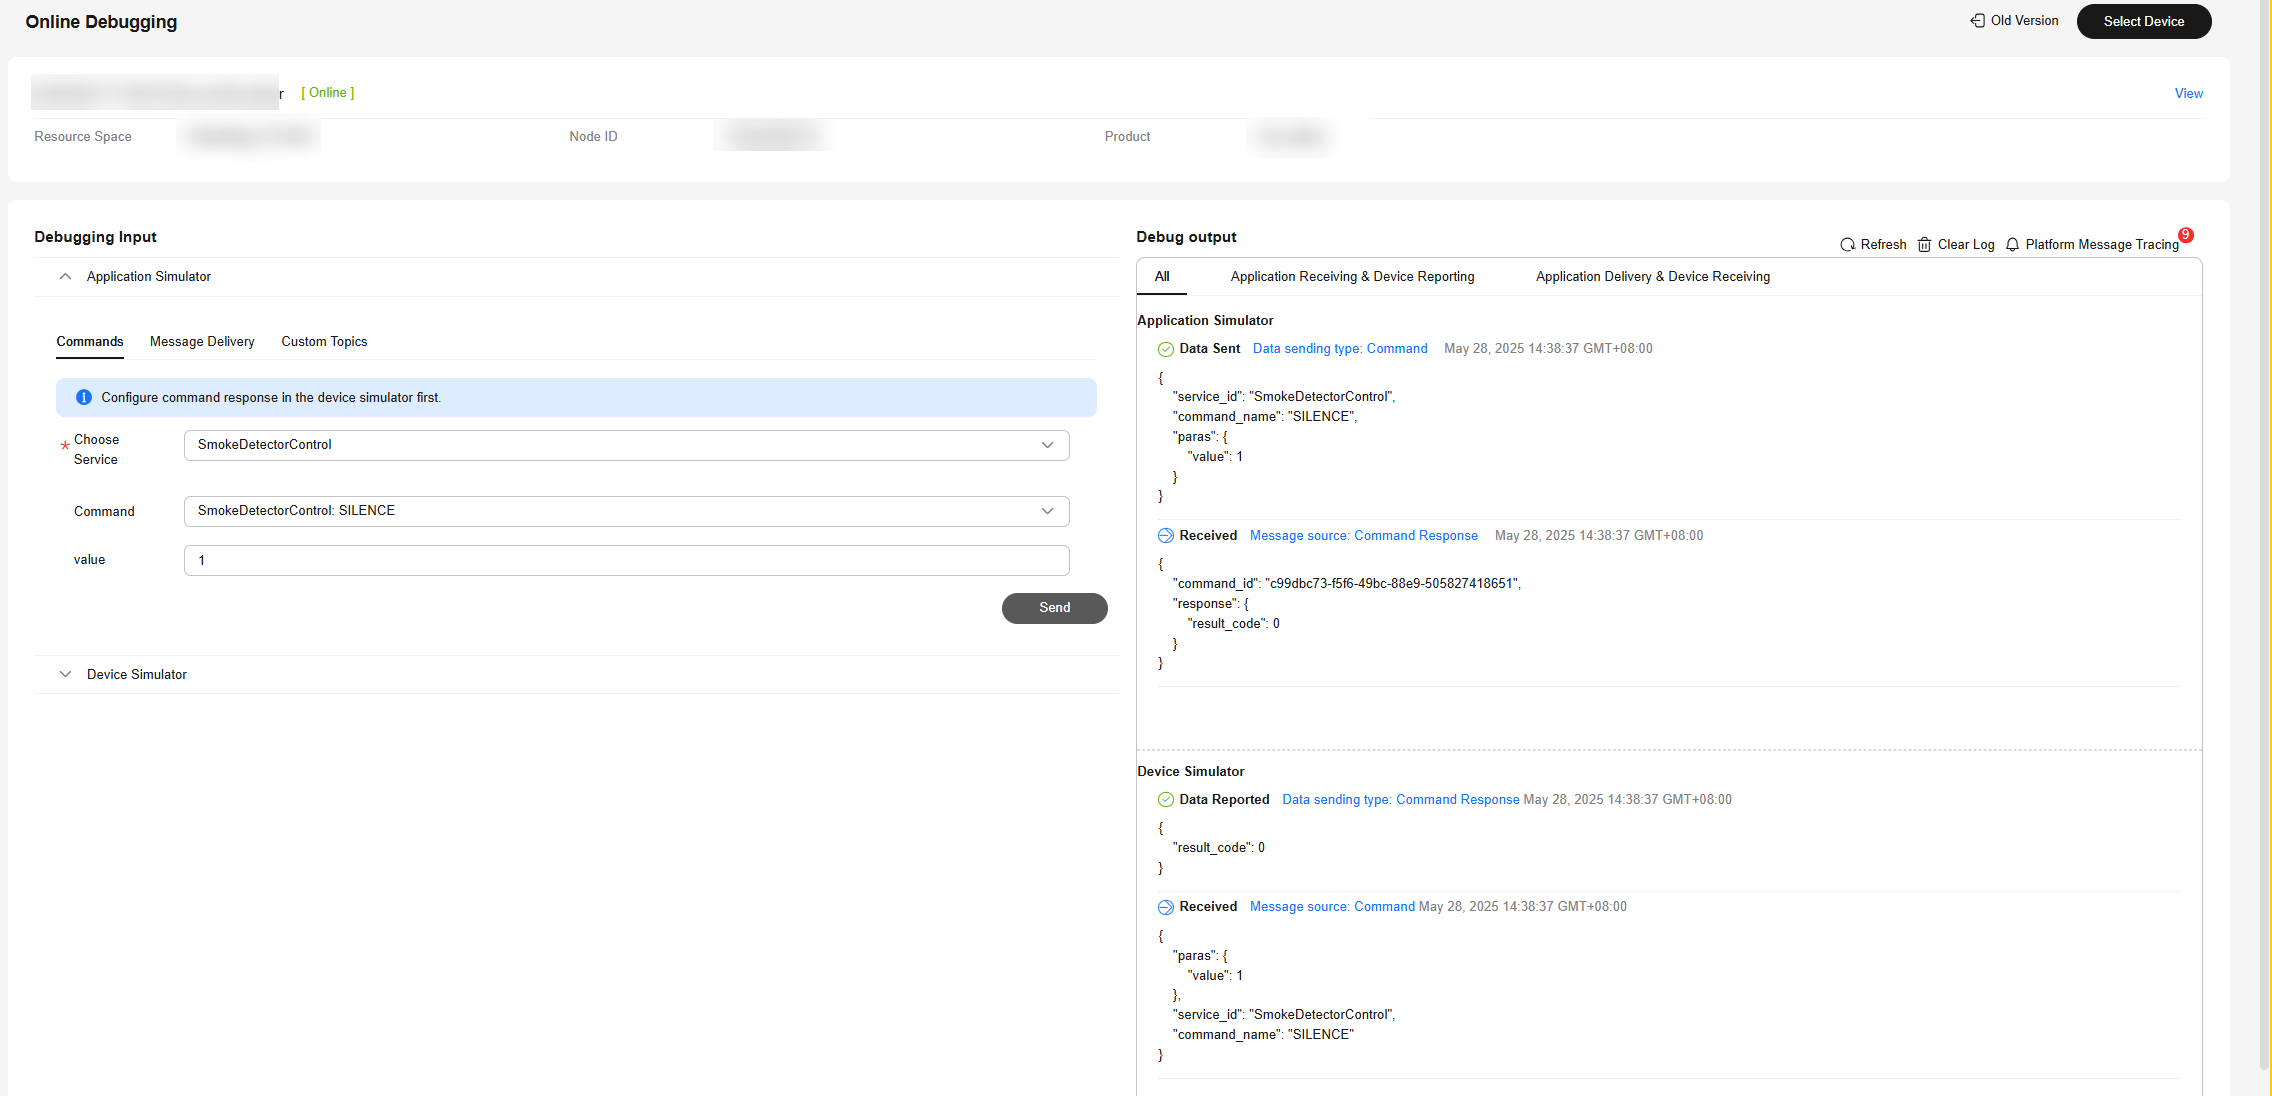
- In the Application Simulator area, select the usage scenario. Options: command delivery, message delivery, and message delivery via custom topics. For example, to deliver a command, click the command delivery tab, select the target service and command, enter the command value, and click Send. Check the delivered command and the received command response in the application simulator record area on the right, and check the command received by the device and the command response reported by the device in the device simulator record area.

For command delivery, you can set the response reported by the device to the platform on the command response tab page of the device simulator.
For message delivery via custom topics, you can use the device to subscribe to the target topic on the subscription tab page of the device simulator.
Figure 6 Online debugging - Command delivery
Debugging a Product by Using a Physical Device
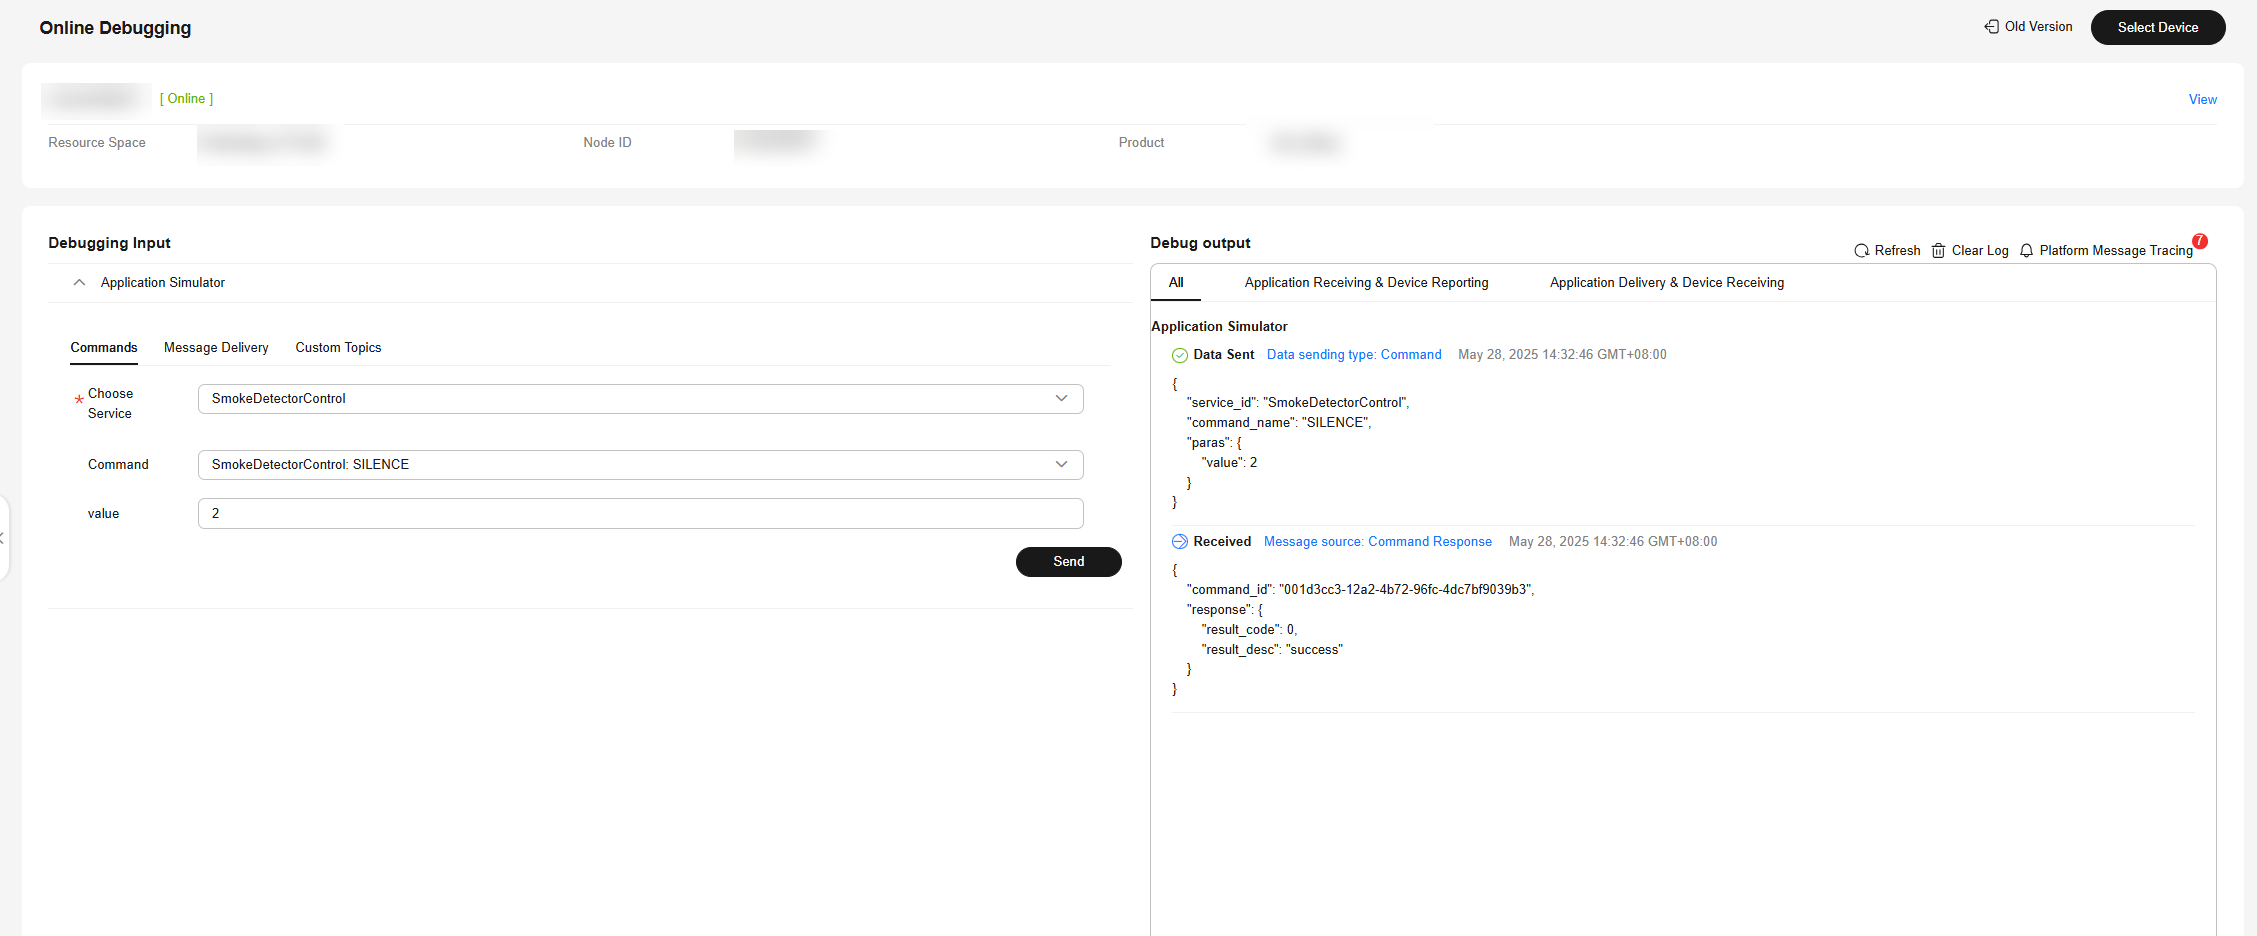
When the device development is complete but the application development is not, you can add physical devices and use the application simulator to test devices, product models, and codecs. The physical device debugging page consists of the following parts:
- Device information area (upper part): displays the basic information about the device that is being debugged, including the device name, device status, device ID, resource space, and product.
- Application simulator area (left part): You can simulate an application to deliver commands, messages, and messages with custom topics.
- Application simulator record area: displays the data received and delivered by the application.

Next, you can create a physical device for online debugging.
- On the product details page, click the Online Debugging tab and click Add Test Device.
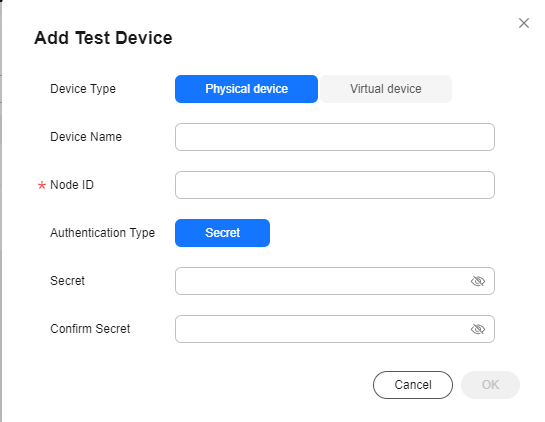
- In the Add Test Device dialog box, select Physical device for Device Type, set the parameters of the device, and click OK. Figure 8 Online debugging - Adding a test device

Note: If DTLS is used for access, keep the key secure.

The newly added device is in the inactive state. In this case, online debugging cannot be performed. For details, see Device Connection Authentication. After the device is connected to the platform, perform the debugging.
- Click Debug to access the debugging page. Figure 9 Entering debugging

- On the displayed page, the device status is Online. Figure 10 Online Commissioning - Online devices

- In the Application Simulator area, select the usage scenario. Options: command delivery, message delivery, and message delivery via custom topics. For example, to deliver a command, click the command delivery tab, select the target service and command, enter the command value, and click Send. Check the delivered command and the received command response in the application simulator record area on the right. Your physical device can receive the delivered commands and perform corresponding actions. Figure 11 Online debugging - Physical devices

Feedback
Was this page helpful?
Provide feedbackThank you very much for your feedback. We will continue working to improve the documentation.See the reply and handling status in My Cloud VOC.
For any further questions, feel free to contact us through the chatbot.
Chatbot


