
Connecting ServiceComb Engine Dashboard Data to AOM through ServiceStage
Background
For Java chassis applications connected to the ServiceComb engine, the real-time monitoring data on the ServiceComb engine dashboard is retained for 5 minutes by default. To permanently store historical monitoring data for subsequent query and analysis, use the custom metric monitoring function of ServiceStage to connect the microservice data displayed on the ServiceComb engine dashboard to AOM.
This section uses the application deployed using a software package as an example to describe how to complete the connection.
Procedure
- Add dependency.
In the development environment, open the application project that requires persistent storage of historical monitoring data and add the following dependency to the pom file of the microservice:
<dependency> <groupId>org.apache.servicecomb</groupId> <artifactId>metrics-core</artifactId> </dependency> <dependency> <groupId>org.apache.servicecomb</groupId> <artifactId>metrics-prometheus</artifactId> </dependency> - Recompile and package the application project to which the dependency has been added, and upload the package.
- Upload the software package to the SWR software repository. For details, see Uploading the Software Package .
- Upload the software package to the OBS bucket. For details, see Streaming Upload (PUT).
- If you need to use JFrog (example) as the software package repository, you can download the package from the HTTP/HTTPS custom file address. Upload the software package to the corresponding custom file address in advance.
- Deploy the application component.
- Deploy the component that is packaged and uploaded in 2. For details, see Creating and Deploying a Component Based on a Container Using UI Configurations.
- During component deployment, choose Advanced Settings > O&M Policy and configure the following parameters:
Parameter
Value
Report Path
/metrics
Report Port
9696
Figure 1 Setting custom monitoring
- After the component is successfully deployed, go to 6.
- During component deployment, choose Advanced Settings > O&M Policy and configure the following parameters:
- Connect monitoring metrics to AOM.
- Log in to ServiceStage.
- Choose Application Management.
- Click the application where the component is located. The Overview page of the application is displayed.
- In the Component List area, click the target component. The component overview page is displayed.
- Click Deploy.
- Select Single-batch Release and click Next.
- Choose Advanced Settings > O&M Policy and configure the following parameters:
Parameter
Value
Report Path
/metrics
Report Port
9696
Figure 2 Monitoring metrics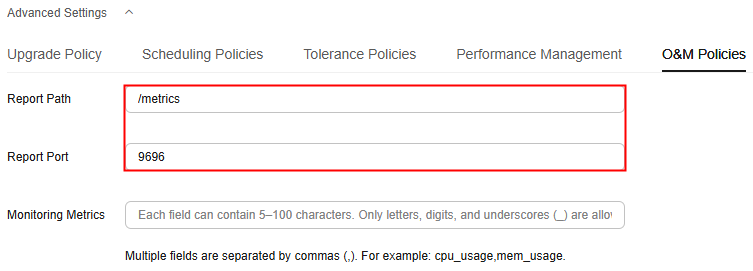
- Click Deploy and wait until the component is redeployed successfully.
- On the AOM console, view monitoring metrics and export monitoring data. For details, see Metric Monitoring.
Feedback
Was this page helpful?
Provide feedbackThank you very much for your feedback. We will continue working to improve the documentation.See the reply and handling status in My Cloud VOC.
For any further questions, feel free to contact us through the chatbot.
Chatbot


