Testing MQTT Performance Using JMeter
Scenarios
The number of global IoT device connections is increasing with the development of IoT technologies. The access and management of devices at scale pose great challenges to the network bandwidth, communications protocols, and platform architecture. It is important to test the platform performance during IoT architecture selection. This section describes how to use JMeter to perform a performance pressure test on the MQTT access capability of the platform.
The test plan is described as follows:
Test scenario:
- Simulate 10,000 concurrently online devices to verify the stability of platform persistent connections.
- Simulate a scenario where devices initiate 100 message reporting requests per second to verify the message processing capability of the platform.
Test environment:
- Test object: Huawei Cloud IoTDA SU2 (10,000 online devices and 100 TPS upstream and downstream messages)
- Test executor: One JMeter executor. The specifications are as follows:
|
Instance Type |
Flavor |
Number of vCPUs |
Memory |
|---|---|---|---|
|
General computing S6 |
s6.xlarge.2 |
4 vCPUs |
8 GiB |

A single JMeter executor can simulate up to 50,000 online devices. To simulate more online devices, use Huawei Cloud CPTS and deploy multiple JMeter executors.
Prerequisites
- You have registered a Huawei ID and enabled Huawei Cloud services.
- You have subscribed to IoTDA. If not, access IoTDA and buy an SU2 unit (10,000 online devices and 100 TPS upstream and downstream messages).
Preparations
- Install the Java runtime environment on the JMeter executor. Visit the Java website, and download and install the Java runtime environment.
- Download and install JMeter 5.1.1 or later.
- Download the mqtt-jmeter plug-in package and store it in the directory of the JMeter installation directory.
Service Flow
The process of using JMeter to perform an MQTT performance pressure test on the platform is as follows:
- Create an MQTT product.
- Register 10,000 devices in batch import mode.
- Import the test plan created for the IoT performance test.
- Initiate a platform performance pressure test based on service specifications.
- View the test result. Check whether the test result meets the expectation based on the monitoring metrics displayed on the IoT platform.
Creating a Product
- Log in to the console, choose Products in the navigation pane, and click Create Product.
- Set the parameters as prompted and click OK.
Table 2 Parameters Basic Information
Resource Space
The platform automatically allocates the created product to the default resource space. You can also select an existing resource space from the drop-down list or create one.
Product Name
Customize the value. The name can contain letters, numbers, underscores (_), and hyphens (-).
Protocol
Select MQTT.
Data Type
Select JSON.
Industry
Set this parameter as required.
Device Type
Set this parameter as required.
Advanced Settings
Product ID
Set a unique identifier for the product. If this parameter is specified, the platform uses the specified product ID. If this parameter is not specified, the platform allocates a product ID.
Registering a Batch of Devices
- Visit the IoTDA service page and click Access Console.
- In the navigation pane, choose , click the Batch Registration tab, and then click Batch Register.
- Download and fill in the batch device registration template based on the following table. You can download the sample file.
Table 3 Parameters Parameter
Description
node_id
Device identifier. Set this parameter in ascending order, for example, 10001, 10002, and 10003.
product_id
Product ID generated in Creating a Product.
app_id
Resource space. For details about how to obtain the resource space, see Resource Spaces.
device_name
Device name, which can be the same as the value of node_id.
secret
Device secret. You can enter a fixed secret during a performance test.
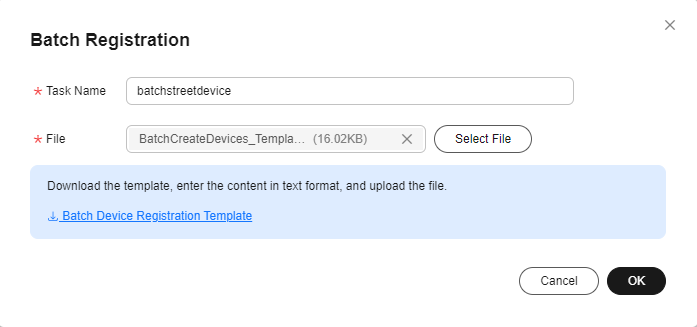
- In the Batch Registration dialog box, click Select File to upload the prepared batch registration template, and click OK.
Figure 1 Device - Registering devices in batches

- After the batch registration is successful, save the device IDs and secrets.
Importing a Test Plan
- Download the JMeter test plan.
- Open JMeter and click Open to import the downloaded test plan.
- In the JMeter directory on the left, choose User Defined Variables. On the page, configure the following parameters:
Table 4 Parameters Parameter
Description
server
MQTT server address. For details about how to obtain the value, see Obtaining Resources.
port
MQTT port number. Set this parameter to 8883.
productId
Product ID generated in Creating a Product.
password
MQTT connection password, which is the value of the device secret encrypted by using the HMAC-SHA256 algorithm with the timestamp as the key. secret is the secret entered during batch device registration. You can use this tool to obtain the encrypted value.
timeStamp
Timestamp used for encrypting the password. The time format is YYYYMMDDHH.
Figure 2 Example
Initiating a Pressure Test
- In the JMeter directory on the left, choose Thread Group, set Number of Threads to 10000. (A thread corresponds to an online device. 10000 indicates that 10,000 devices are online on the IoT platform.)
Figure 3 Configuring devices

- In the JMeter directory on the left, choose Thread Group > Delay between sampler. Set Thread Delay (in milliseconds) to 100000 (indicating that each device publishes a message every 100 seconds).
Figure 4 Configuring devices

- Click
 on the JMeter toolbar to start the performance test.
Figure 5 Performance test
- In the JMeter directory on the left, choose Summary Report. The throughputs of Connect and Publish Message are displayed. You can modify the values of Number of Threads and Thread Delay (in milliseconds) to adjust the throughputs.
Figure 6 Performance test

- After the JMeter test plan is debugged, import the test plan to CodeArts PerfTest for distributed deployment to meet requirements of higher-level performance tests.
Viewing the Pressure Test Result
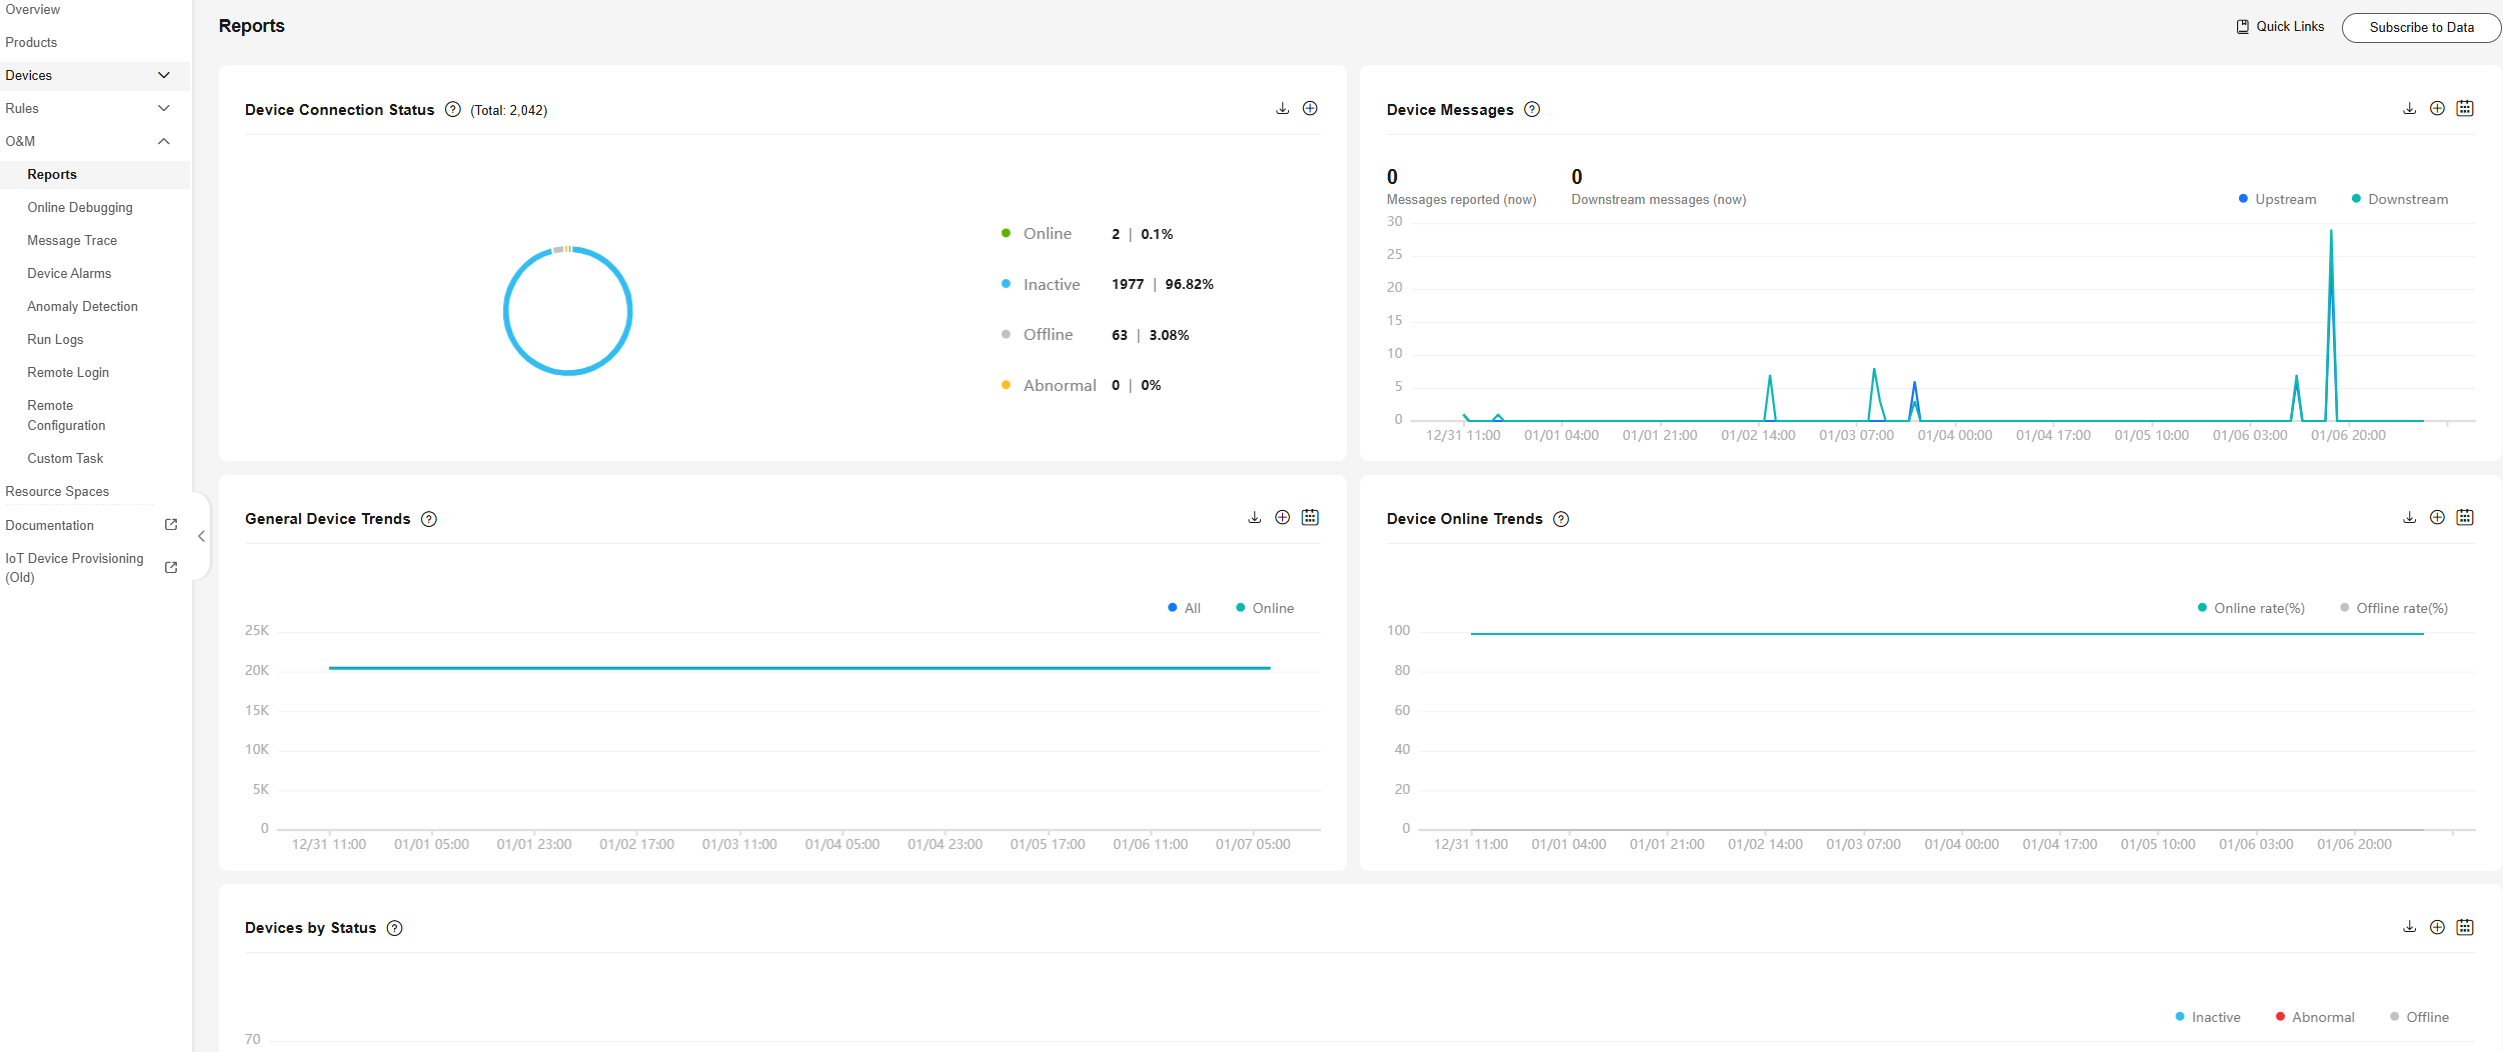
- Log in to the IoTDA console and choose O&M > Reports in the navigation pane to view statistical metrics of the platform.
Figure 7 Viewing statistical reports

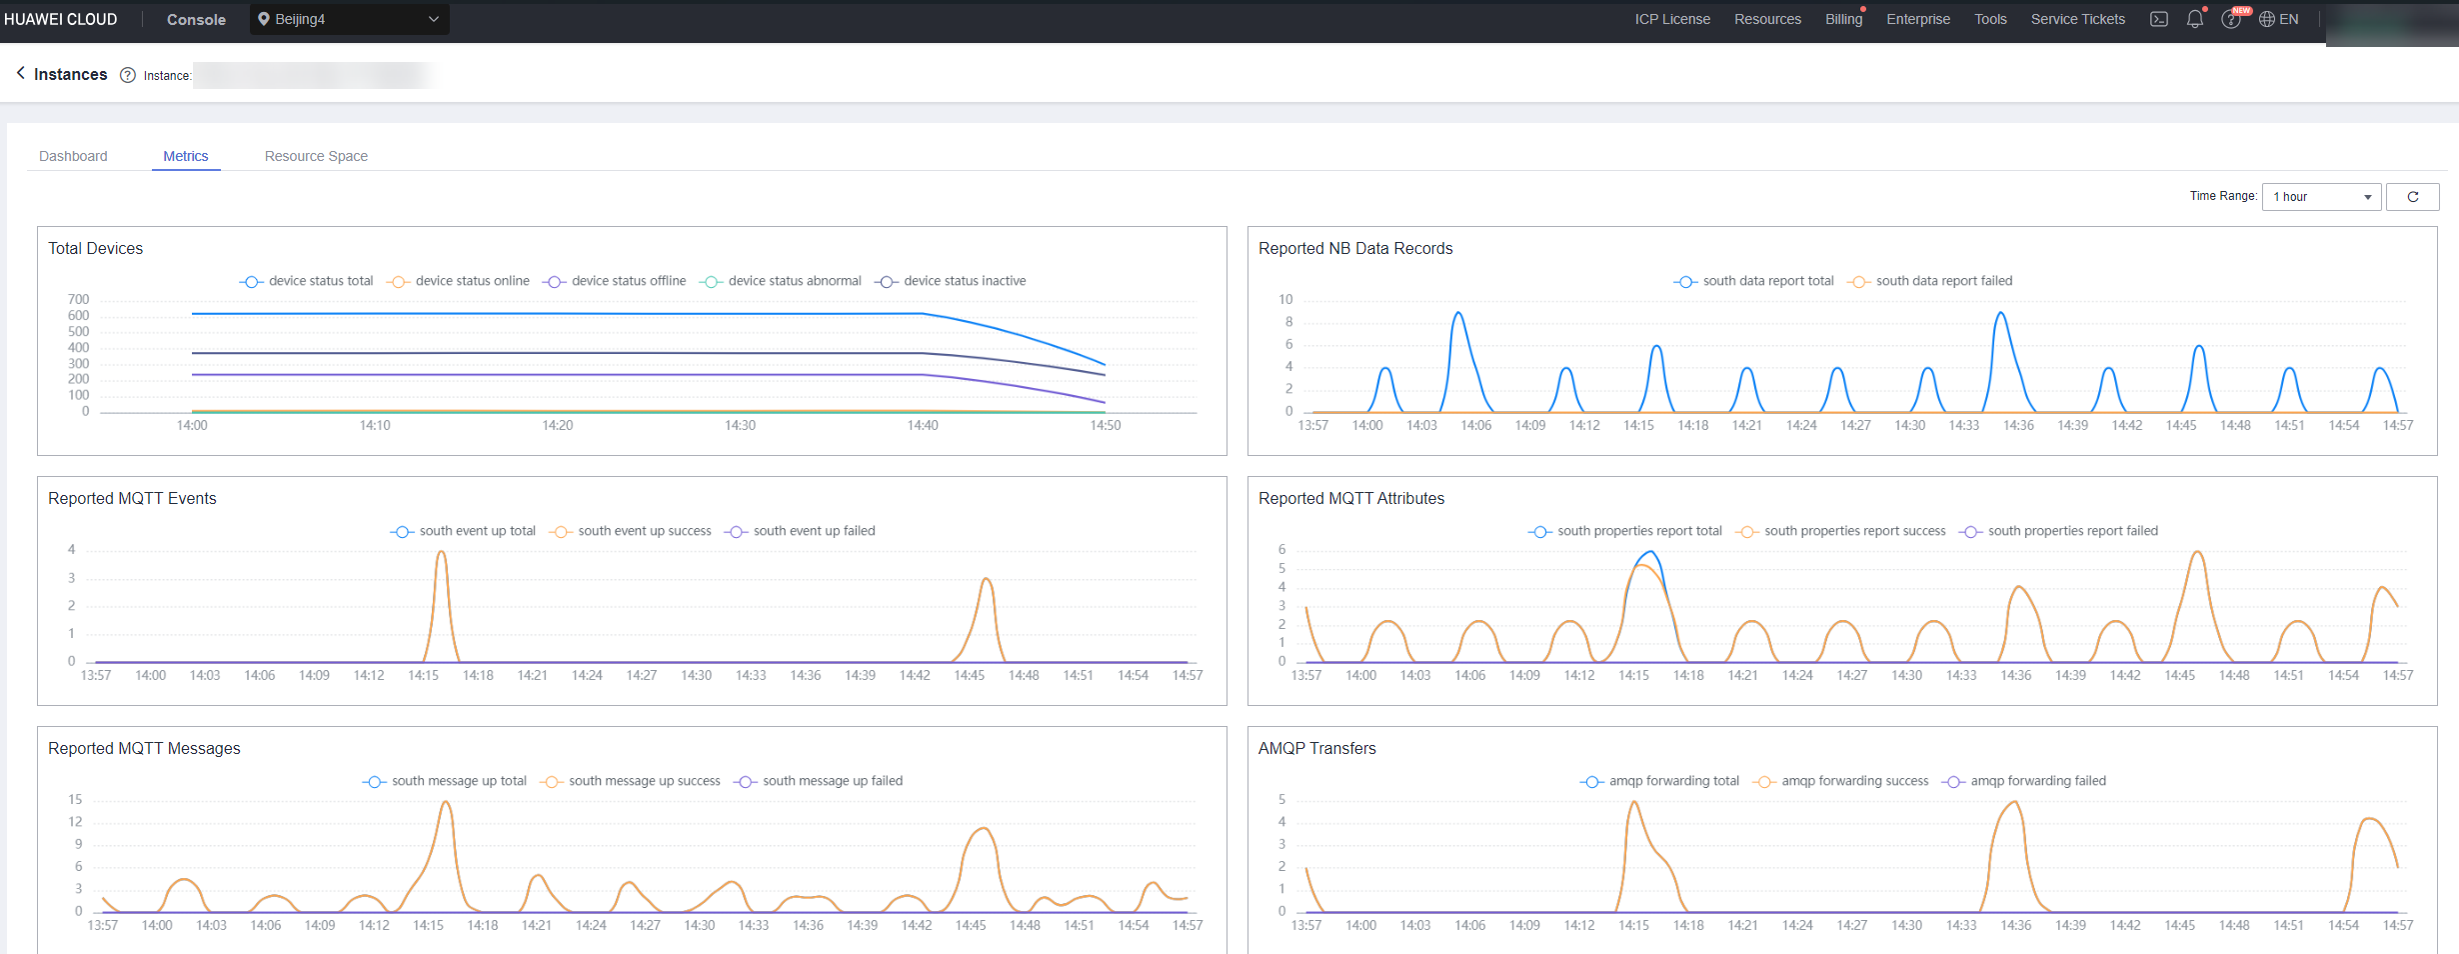
- For more reports, log in to the Application Operations Management (AOM) console, choose Monitoring > Cloud Service Monitoring, and select IoT Device Access (IoTDA).
Figure 8 Viewing metrics

Feedback
Was this page helpful?
Provide feedbackThank you very much for your feedback. We will continue working to improve the documentation.See the reply and handling status in My Cloud VOC.
For any further questions, feel free to contact us through the chatbot.
Chatbot


