
Introduction to Stream Data Warehouse
In the IoT era, collecting massive device status and service message data enables device monitoring, service analysis and prediction, and fault diagnosis.
For example, a self-driving vehicle uses many sensors to collect its running data in real time, such as GPS coordinates, speeds, directions, temperatures, and power. Each vehicle generates terabytes of data each day. The data is time sensitive and is collected at fixed intervals. This type of data is called time series data. Analyzing time series data helps us understand not only the real-time status of different objects, but also useful trends and patterns. It can even help us predict the future.
The GaussDB(DWS) stream data warehouse uses Huawei's in-house developed time series engine. It provides extended time series syntax, and functions for partition management and time series computation, as well as those from ecosystem partners. Time series computation is performed based on time series tables.
Differences Between Stream Data Warehouse and Cloud Data Warehouse
The stream data warehouse and cloud data warehouse are two different GaussDB(DWS) products and have different applications. For details, see Table 1.
Data Warehouse |
Standard Data Warehouse |
Stream Data Warehouse |
||
|---|---|---|---|---|
Application scenarios |
Converged data analysis using OLAP. It is used in sectors such as finance, government and enterprise, e-commerce, and energy. |
Application performance monitoring, environment monitoring, system monitoring, autonomous driving, and IoT. |
||
Advantages |
Cost effective, both hot and cold data analysis supported, elastic storage and compute capacities. |
Efficient time series computation and IoT analysis. Support for real-time and historical data association, built-in time series operators, massive data write, high compression ratio, and multi-dimensional analysis. It performs excellently where the cloud data warehouse is typically used. |
||
Features |
Excellent performance in interactive analysis and offline processing of massive data, as well as complex data mining. |
Aggregation of tens of millions of timelines within seconds, much faster IoT data importing and query than traditional engines. |
||
SQL syntax |
Compatible with the SQL syntax of the cloud data warehouse. |
Added the DDL syntax specific to the standard data warehouse. |
||
GUC parameters |
A wide variety of GUC parameters enable customers to configure a data warehouse environment best suited to their needs. |
Support for the GUC parameters of the standard data warehouse; added new GUC parameters for stream data warehouse optimization. |
||
Data Features
There are three types of columns in a time series table:
- Tag column: This column stores data source and attribute information. The values in this column are stable and do not change with time.
- Field column: This column stores metric values, and the values change with time.
- Time column: This column stores timestamps.
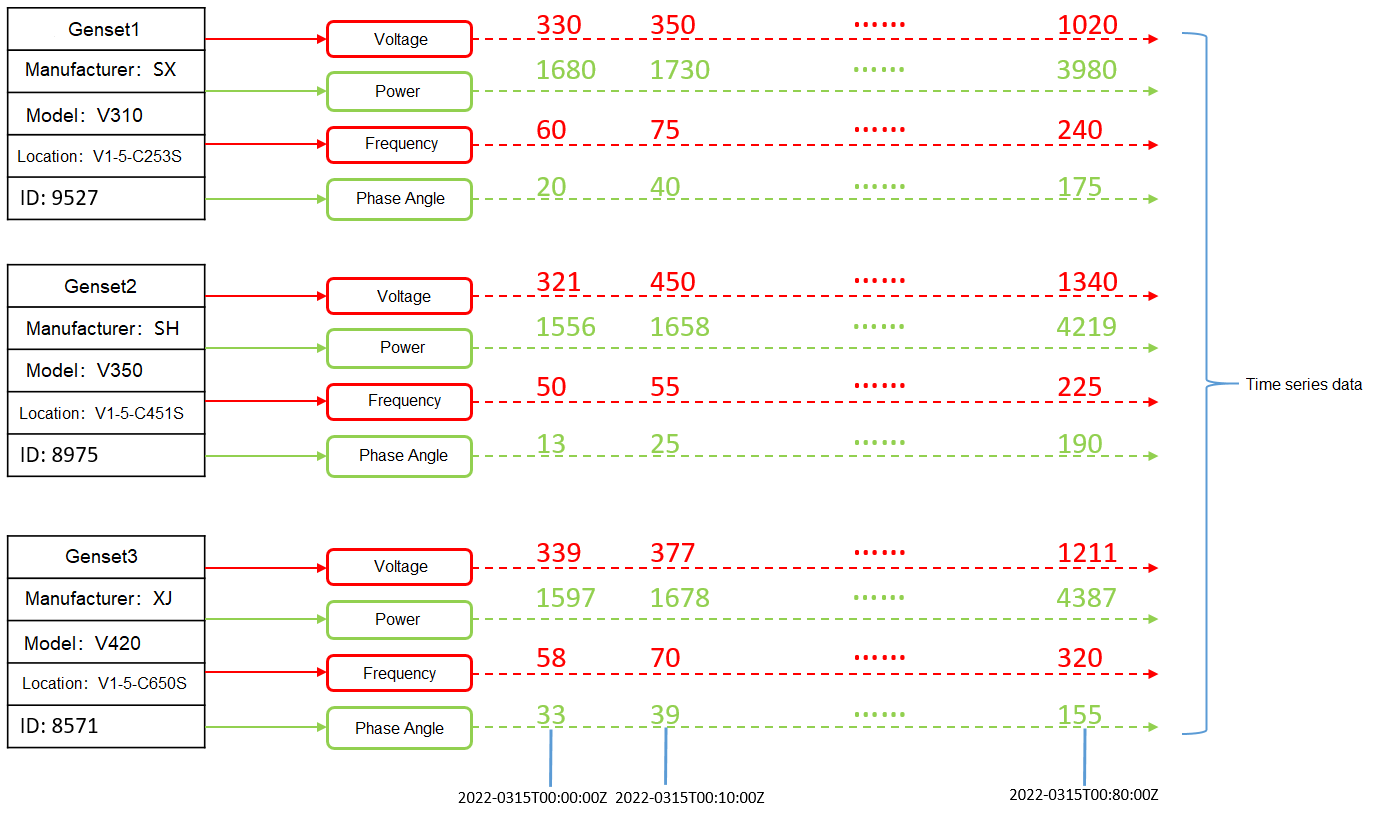
Figure 1 shows a sample of genset data. The data of voltage, power, frequency, and current phase angle is collected on three gensets. Data is continuously collected at a fixed interval and continuously sent to a storage system. Each dashed line in the diagram represents a time line.
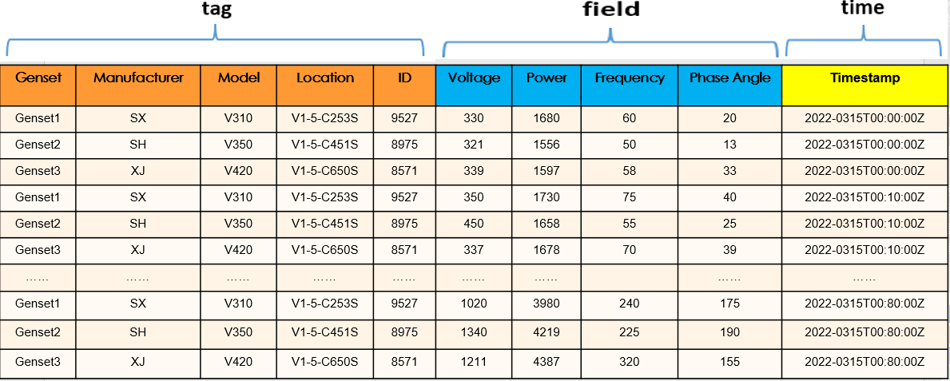
The data shown in Figure 1-1 is stored in tables similar to the one shown in Figure 2. The tag + field + time combination determines the timeline showing the value changes of each metric.
The tag columns (orange headers) contain information such as the genset name, manufacturer, model, location, and ID, which do not change with time.
The field columns (blue headers) contain information such as the voltage, power, frequency, and current phase angle. The values in these columns change over time.
The time column (yellow header) contains timestamps, which indicate the time when the sample was taken.
Technical Highlights
- Massive data write throughput
If five metrics (speed, temperature, engine power, direction, and coordinates) are collected from 10 million self-driving vehicles, 50 million transactions will be generated per second.
- Stable and continuous write
Time series data is generated and collected at a fixed frequency, so the write speed is relatively stable.
- More writes and fewer reads
In a stream data warehouse, around 90% of the operations on time series data are writes. For example, in a monitoring scenario, a large amount of data needs to be stored every day, but only a small amount of data needs to be read. Generally, you pay attention to only a handful of key metrics within specific time periods.
- High compression ratio
A high compression rate benefits customers in two ways. The first is reduced storage costs because a smaller disk space is needed. The second is that compressed data can be stored in the memory more easily, which significantly improves query performance.
- Real-time data writing
Time series data is written into the warehouse in real time. Data is continuously generated, and there is no need to update the old data.
- High data read rate
The latest data is more valuable. Therefore, it is more likely to be read. For example, in a monitoring scenario, monitoring data of the last several hours or days is most likely to be accessed, and data of a quarter or a year ago is seldom accessed.
- Multidimensional analysis
The stream data warehouse supports flexible, multidimensional data analysis. For example, when monitoring the network traffic of a cluster of nodes, you can choose to monitor either the traffic of each individual node or that of the entire cluster as a whole.
Application Scenarios
There are two typical use cases of a stream data warehouse: application performance management (APM) and Internet of Things (IoT).
- Retail: e-commerce transaction amount, payment amount, inventory, and logistics data
- Finance: stock price and transaction volume recorded by the stock trading system
- People's lives: hourly power consumption data recorded by smart meters
- Industrial: data of industrial machines, for example, real-time rotational speed, wind speed, and energy yield data of wind turbines.
- System monitoring: IT infrastructure load and resource usage, DevOps monitoring data, and mobile/web application event flows
- Environment monitoring: data of natural environment (such as temperature, air, hydrology, and wind force) and scientific measurements
- City management: city traffic monitoring (vehicles, people flow, and roads)
- Self-driving: real-time environment data of self-driving cars
Feedback
Was this page helpful?
Provide feedbackThank you very much for your feedback. We will continue working to improve the documentation.See the reply and handling status in My Cloud VOC.
For any further questions, feel free to contact us through the chatbot.
Chatbot


