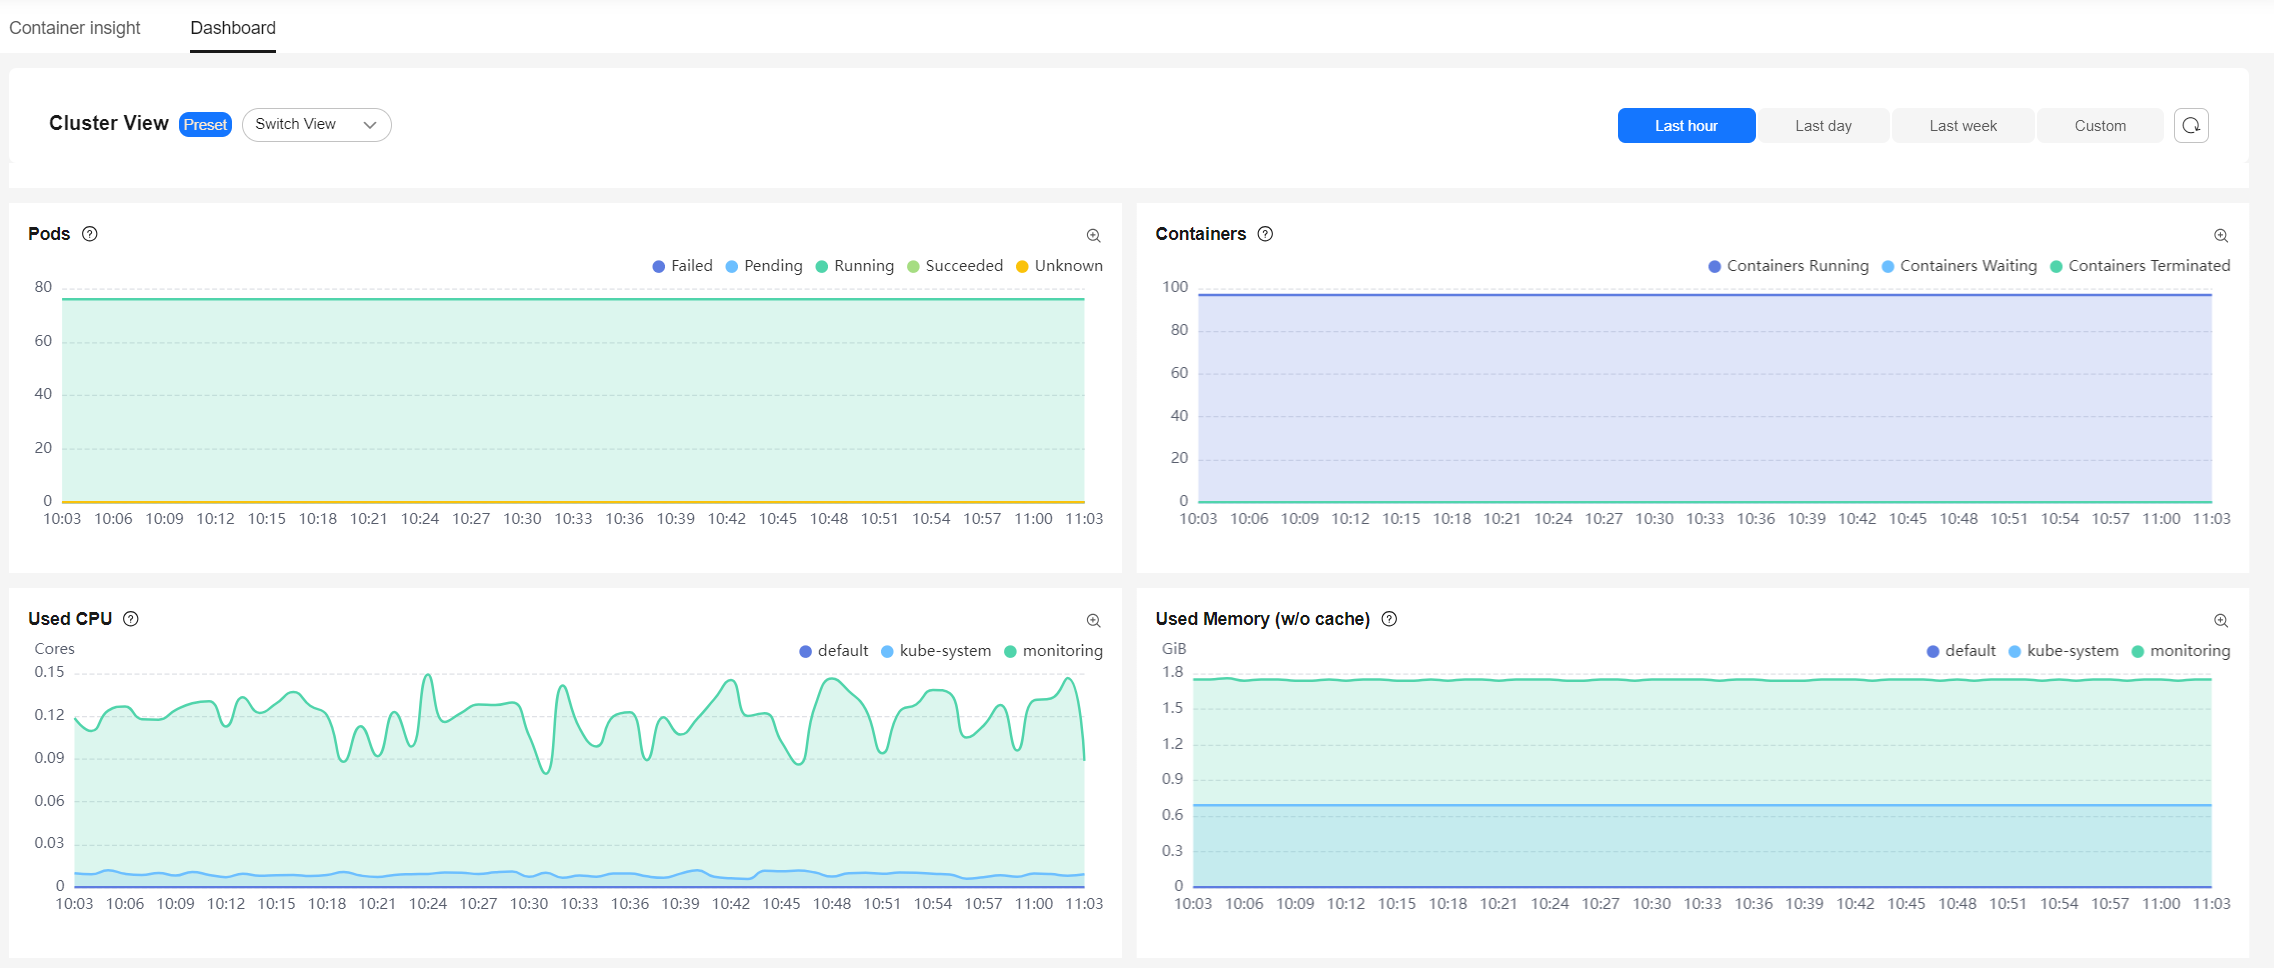
Cluster View
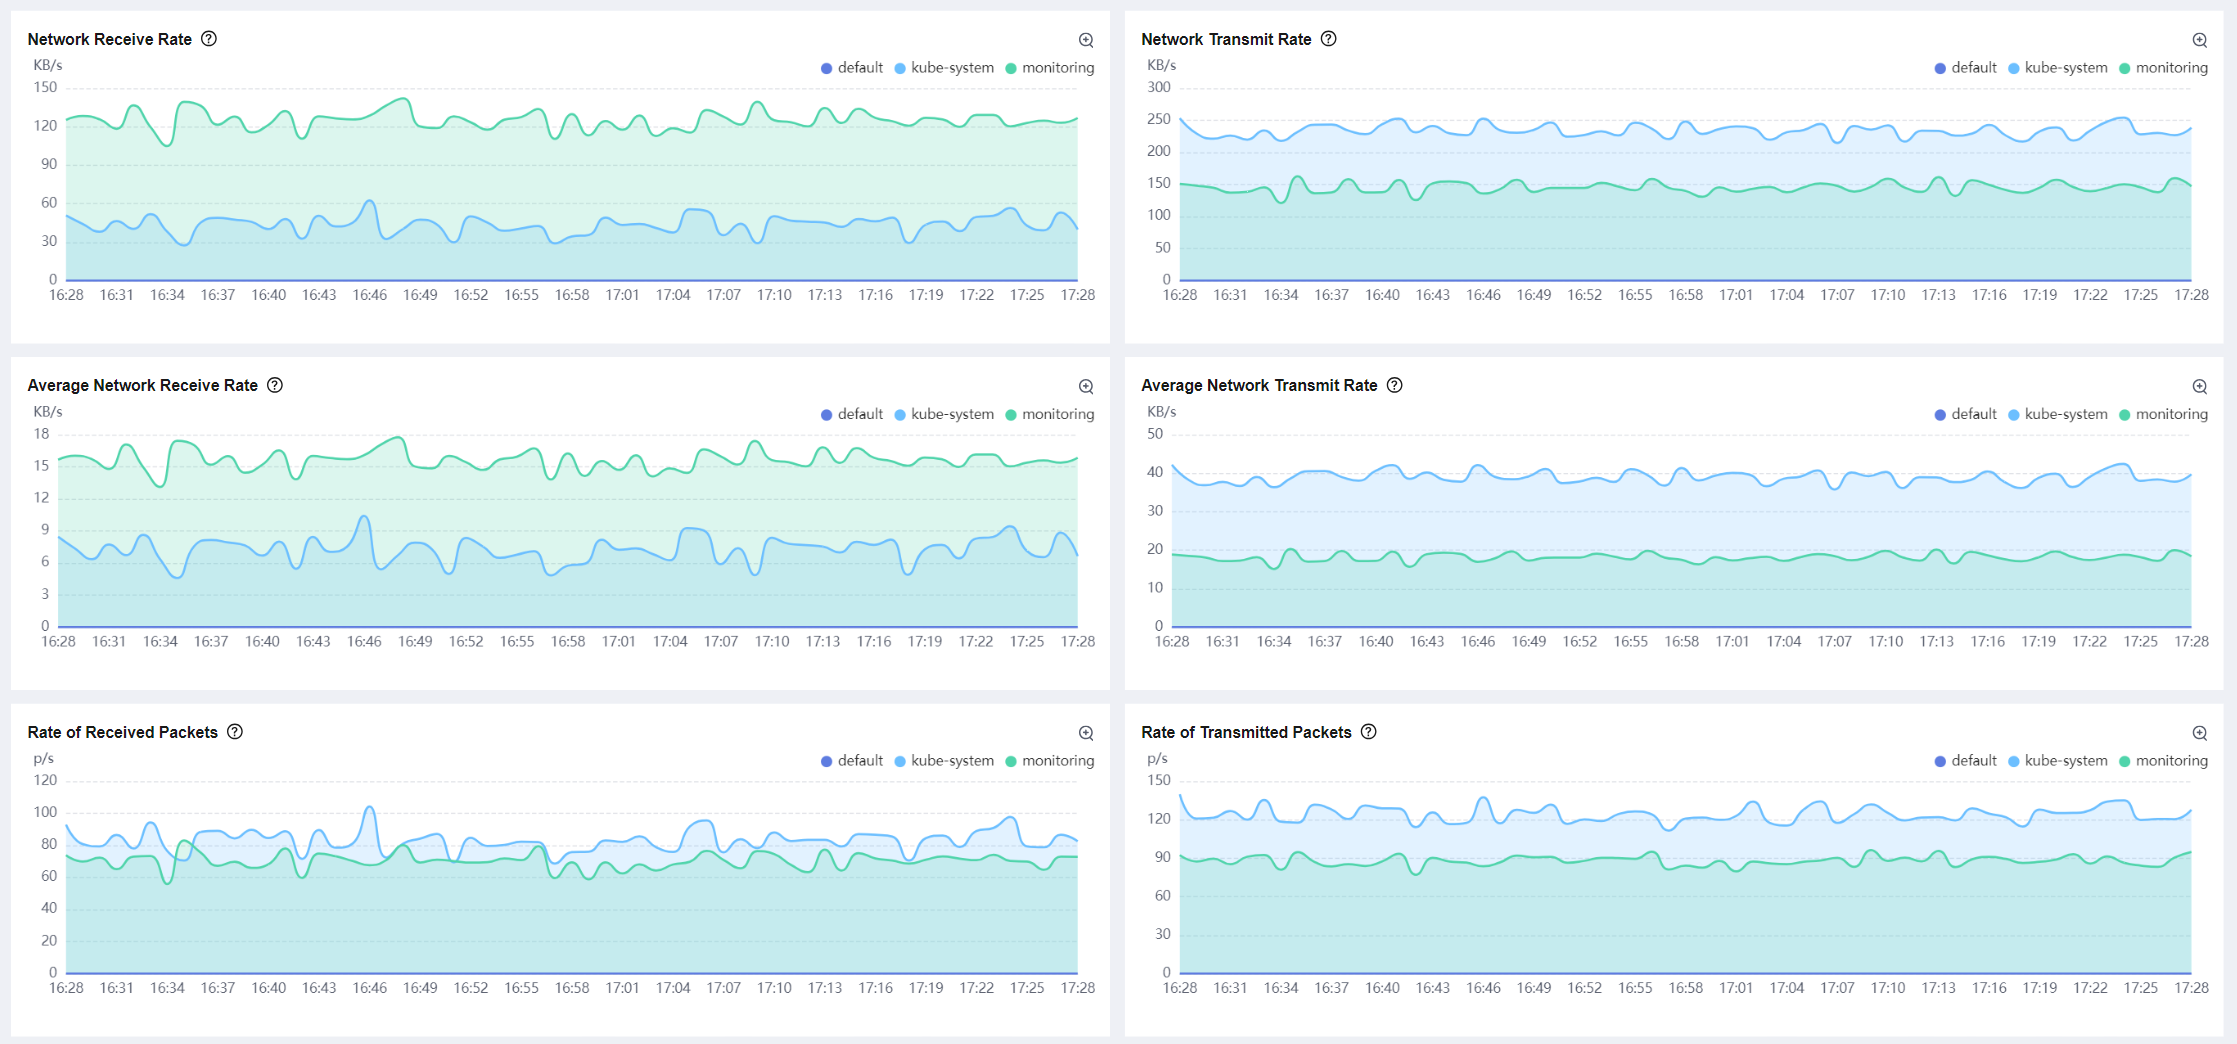
A cluster view is generated based on metrics and Prometheus Query Language (PromQL). It displays information about pods, containers, CPUs, memory, networks, and disks, allowing you to better monitor the running of a cluster. The following describes cluster resources from two parts: metric description and metric list. In the resource diagrams, larger values in bytes can be converted to ones in MB, KB, or GB.
Metric Description
The cluster view displays basic resource metrics, network metrics, and disk metrics.

|
Metric |
Unit |
Description |
|---|---|---|
|
Pods |
Count |
Number of pods in different states (Failed, Pending, Running, Succeeded, and Unknown) in a cluster |
|
Containers |
Count |
Number of containers in different states (Containers Running, Containers Waiting, and Containers Terminated) in a cluster |
|
Used CPU |
Core |
Total number of CPUs used by all containers in each namespace |
|
Used Memory |
Byte |
Total amount of memory used by all containers in each namespace |

|
Metric |
Unit |
Description |
|---|---|---|
|
Network Receive Rate |
Byte/s |
Total number of bytes received by all containers in each namespace per second |
|
Network Transmit Rate |
Byte/s |
Total number of bytes sent by all containers in each namespace per second |
|
Average Network Receive Rate |
Byte/s |
Average number of bytes received by containers in each namespace per second |
|
Average Network Transmit Rate |
Byte/s |
Average number of bytes sent by containers in each namespace per second |
|
Rate of Received Packets |
Count/s |
Total number of packets received by all containers in each namespace per second |
|
Rate of Transmitted Packets |
Count/s |
Total number of packets sent by all containers in each namespace per second |
|
Packet Loss Rate (Receive) |
Count/s |
Total number of packets not received by all containers in each namespace per second |
|
Packet Loss Rate (Transmit) |
Count/s |
Total number of packets sent from all containers but not received by the recipient in each namespace per second |

|
Metric |
Unit |
Description |
|---|---|---|
|
Disk I/O Rate (Read + Write) |
Count/s |
Total number of read and write operations performed on the disk of all containers in each namespace per second |
|
Disk Throughput (Read + Write) |
Byte/s |
Total number of bytes read from and written to the disk of all containers in each namespace per second |
Metric List
The following table lists the metrics used in the cluster view.
|
Metric |
Type |
Description |
|---|---|---|
|
kube_pod_container_resource_requests |
gauge |
Container resource requests |
|
kube_pod_container_resource_limits |
gauge |
Container resource limits |
|
kube_pod_status_phase |
gauge |
Phase of the pod |
|
kube_pod_container_status_waiting |
gauge |
Whether the container is in the waiting state |
|
kube_pod_container_status_terminated |
gauge |
Whether the container is in the terminated state |
|
container_cpu_usage_seconds_total |
counter |
Cumulative CPU time consumed in seconds |
|
container_memory_rss |
gauge |
Resident set size (RSS), which is the amount of space of physical memory (RAM) held by a process. |
|
container_network_receive_bytes_total |
counter |
Cumulative count of bytes received |
|
container_network_transmit_bytes_total |
counter |
Cumulative count of bytes transmitted |
|
container_network_receive_packets_total |
counter |
Cumulative count of packets received |
|
container_network_transmit_packets_total |
counter |
Cumulative count of packets transmitted |
|
container_network_receive_packets_dropped_total |
counter |
Cumulative count of packets dropped while receiving |
|
container_network_transmit_packets_dropped_total |
counter |
Cumulative count of packets dropped while transmitting |
|
container_fs_reads_total |
counter |
Cumulative count of reads completed |
|
container_fs_reads_bytes_total |
counter |
Cumulative count of bytes read |
Feedback
Was this page helpful?
Provide feedbackThank you very much for your feedback. We will continue working to improve the documentation.See the reply and handling status in My Cloud VOC.
For any further questions, feel free to contact us through the chatbot.
Chatbot


