Subscribing to an Event
Scenarios
This section describes how to configure SMN to obtain server status information of cloud applications, such as creation, startup, shutdown, restarting, deletion, recomposing, upgrading, as well as image creation, and report the information to Cloud Trace Service (CTS) to improve the APS access speed and operation accuracy.

Message queues may be blocked or CTS may fail to be called due to the event notification mechanism. Therefore, users cannot completely depend on event notifications. Instead, they need to periodically call APIs to update data. For details, see Workspace Application Streaming API Reference. For any questions, submit a service ticket for technical support.
Procedure
Configuring a subscription event
- Enable CTS.

When CTS is enabled, a system tracker is automatically created. You can use this tracker.
- Create an SMN topic.
- Add a subscription.
- Configure key event notifications.

Configure parameters for key event notifications as follows:
- Notification name: This parameter is user-defined, for example, keyOperate_WorkspaceAPP.
- Operation type: Select Custom. In the operation list, set Select Service to WorkspaceAPP, Select Resource to server or session, and Select Operation to createServer, rebootServer, startServer, stopServer, deleteServer, reinstallServer, changeServerImage, createServerImage, sessionConnect, sessionDisconnect, or sessionLogout.
- User: not specified.
- Notification: yes.
- Topic: Select the topic created in 2.
Verifying the subscription event

- Whenever a cloud server is created, started, shut down, restarted, deleted, recomposed, or upgraded, whether successful or failed, an image is successfully created or fails to be created, or a session is connected, disconnected, or logged out, the system automatically reports an event to CTS. You will receive a message based on the protocol configured in 3. For example, if you select email, you will receive a notification email.
- You can also view all traces on the CTS console.
- Log in to the console.
- Expand the service list and choose Management & Governance > Cloud Trace Service.
- On the Trace List page, set Trace Source to WorkspaceAPP, Resource Type to server or session, and search by Trace Name. The trace name is shown in Table 1.
Table 1 Types of events that can be traced Operation
Resource Type
Trace Name
Creating a server
server
createServer
Deleting a server
server
deleteServer
Shutting down a server
server
stopServer
Starting a server
server
startServer
Restarting a server
server
rebootServer
Creating an image
server
createServerImage
Upgrading an image
server
changeServerImage
Reinstalling a server
server
reinstallServer
Session connection
session
sessionConnect
Session disconnection
session
sessionDisconnect
Session logout
session
sessionLogout
- Press Enter to query the result.
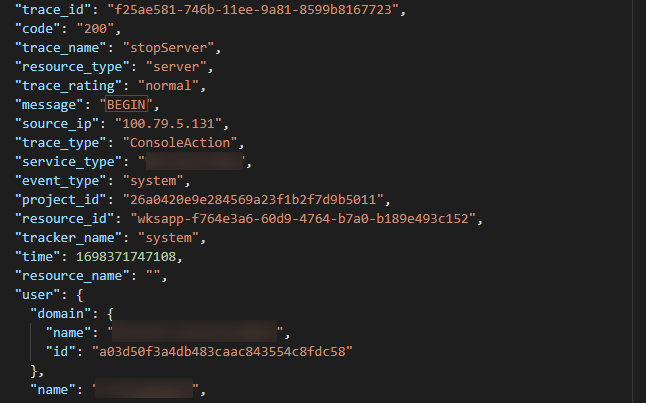
- Take shutting down a cloud server as an example. View Trace Overview of the event. The status is BEGIN, as shown in Figure 1.
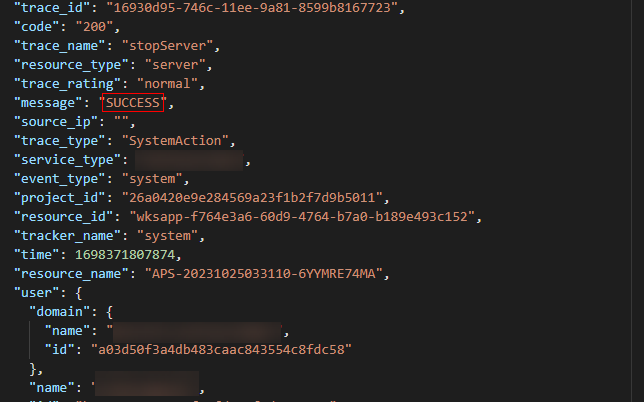
- View Trace Overview of the shutdown event. The server has been shut down, as shown in Figure 2.

- When server creation or deletion fails, a failure trace is reported. In the trace details, the value of Message is FAIL.
- If a server is powered off or not shut down on the homepage of the Workspace client, it is shut down abnormally. In this case, the BEGIN message is not reported in CTS. Only the message indicating that the server has been shut down will be reported.
- Three minutes after the server is started, if the login status is not Ready on the server management page, a failure trace is reported. In the trace details, the value of Message is FAIL.
- Three minutes after the server is shut down, if the login status is not Stopped on the server management page, a failure trace is reported. In the trace details, the value of Message is FAIL.
Feedback
Was this page helpful?
Provide feedbackThank you very much for your feedback. We will continue working to improve the documentation.See the reply and handling status in My Cloud VOC.
For any further questions, feel free to contact us through the chatbot.
Chatbot


