Connecting PostgreSQL Exporter
Application Scenario
When using PostgreSQL, you need to monitor their status and locate their faults in a timely manner. The Prometheus monitoring function monitors PostgreSQL running using Exporter in the CCE container scenario. This section describes how to deploy PostgreSQL Exporter and implement alarm access.
Prerequisites
- A CCE cluster has been created and PostgreSQL has been installed.
- Your service has been connected for Prometheus monitoring and a CCE cluster has also been connected. For details, see Prometheus Instance for CCE.
- You have uploaded the postgres_exporter image to SoftWare Repository for Container (SWR). For details, see Uploading an Image Through a Container Engine Client.
Deploying PostgreSQL Exporter
- Log in to the CCE console.
- Click the connected cluster. The cluster management page is displayed.
- Perform the following operations to deploy Exporter:
- Use Secret to manage PostgreSQL passwords.
In the navigation pane, choose Workloads. In the upper right corner, click Create from YAML to configure a YAML file. In the YAML file, use Kubernetes Secret to manage and encrypt passwords. When starting PostgreSQL Exporter, the secret key can be directly used but the corresponding password needs to be changed as required.
YAML configuration example:
apiVersion: v1 kind: Secret metadata: name: postgres-test type: Opaque stringData: username: postgres password: you-guess # PostgreSQL password. - Deploy PostgreSQL Exporter.
In the navigation pane, choose Workloads. In the upper right corner, click Create from YAML to deploy Exporter.
YAML configuration example (Change the parameters if needed):
apiVersion: apps/v1 kind: Deployment metadata: name: postgres-test # Change the name based on requirements. You are advised to add the PostgreSQL instance information. namespace: default # Must be the same as the namespace of the PostgreSQL service. labels: app: postgres app.kubernetes.io/name: postgresql spec: replicas: 1 selector: matchLabels: app: postgres app.kubernetes.io/name: postgresql template: metadata: labels: app: postgres app.kubernetes.io/name: postgresql spec: containers: - name: postgres-exporter image: swr.cn-north-4.myhuaweicloud.com/aom-exporter/postgres-exporter:v0.8.0 # postgres-exporter image uploaded to SWR. args: - "--web.listen-address=:9187" # Enabled port of Exporter. - "--log.level=debug" # Log level. env: - name: DATA_SOURCE_USER valueFrom: secretKeyRef: name: postgres-test # Secret name specified in the previous step. key: username # Secret key specified in the previous step. - name: DATA_SOURCE_PASS valueFrom: secretKeyRef: name: postgres-test # Secret name specified in the previous step. key: password # Secret key specified in the previous step. - name: DATA_SOURCE_URI value: "x.x.x.x:5432/postgres?sslmode=disable" # Connection information. ports: - name: http-metrics containerPort: 9187 - Obtain metrics.
The running time of the Postgres instance cannot be obtained by running the curl http://exporter:9187/metrics command. To obtain this metric, customize a queries.yaml file.
- Create a configuration that contains queries.yaml.
- Mount the configuration as a volume to a directory of Exporter.
- Use the configuration through extend.query-path. The following shows Secret and Deployment:
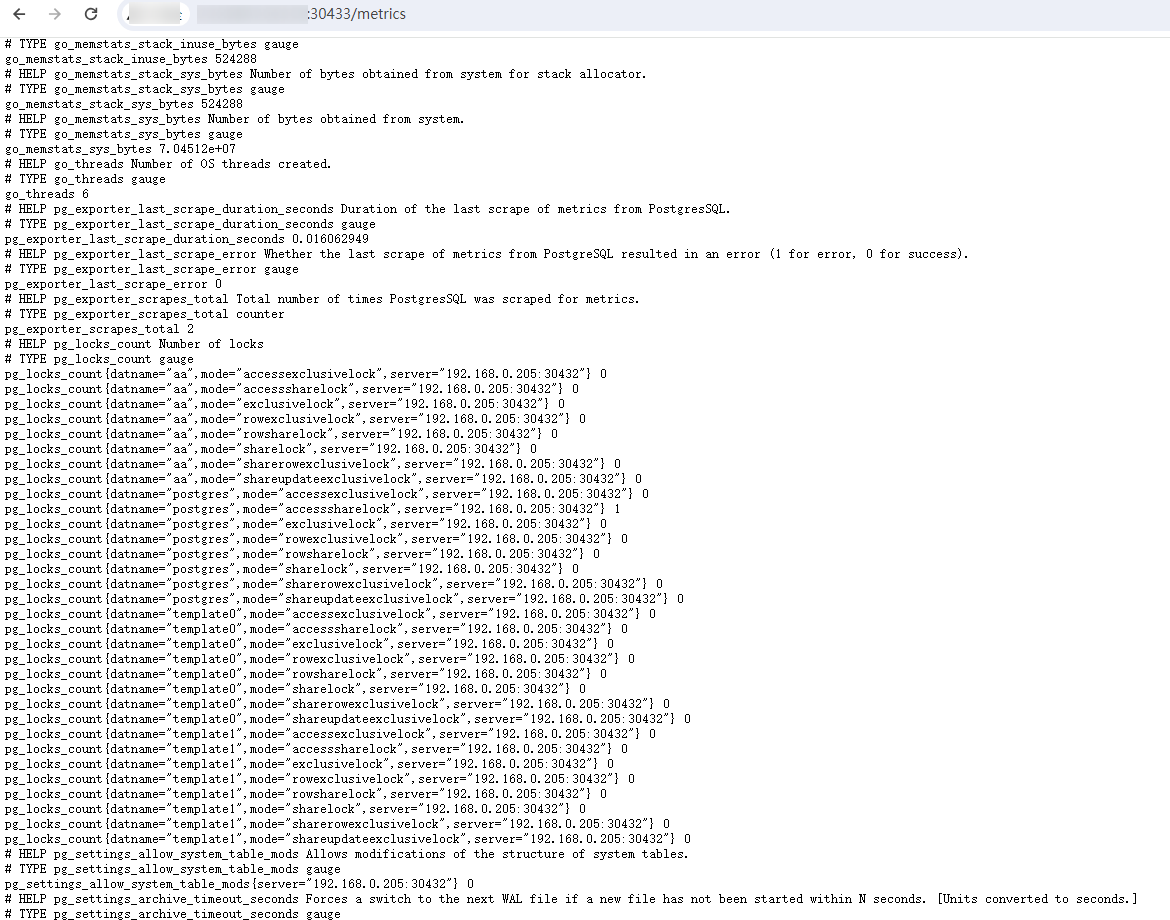
# The following shows the queries.yaml file that contains custom metrics: --- apiVersion: v1 kind: ConfigMap metadata: name: postgres-test-configmap namespace: default data: queries.yaml: | pg_postmaster: query: "SELECT pg_postmaster_start_time as start_time_seconds from pg_postmaster_start_time()" master: true metrics: - start_time_seconds: usage: "GAUGE" description: "Time at which postmaster started" # The following shows the mounted Secret and ConfigMap, and defines Exporter deployment parameters (such as the image): --- apiVersion: apps/v1 kind: Deployment metadata: name: postgres-test namespace: default labels: app: postgres app.kubernetes.io/name: postgresql spec: replicas: 1 selector: matchLabels: app: postgres app.kubernetes.io/name: postgresql template: metadata: labels: app: postgres app.kubernetes.io/name: postgresql spec: containers: - name: postgres-exporter image: wrouesnel/postgres_exporter:latest args: - "--web.listen-address=:9187" - "--extend.query-path=/etc/config/queries.yaml" - "--log.level=debug" env: - name: DATA_SOURCE_USER valueFrom: secretKeyRef: name: postgres-test-secret key: username - name: DATA_SOURCE_PASS valueFrom: secretKeyRef: name: postgres-test-secret key: password - name: DATA_SOURCE_URI value: "x.x.x.x:5432/postgres?sslmode=disable" ports: - name: http-metrics containerPort: 9187 volumeMounts: - name: config-volume mountPath: /etc/config volumes: - name: config-volume configMap: name: postgres-test-configmap --- apiVersion: v1 kind: Service metadata: name: postgres spec: type: NodePort selector: app: postgres app.kubernetes.io/name: postgresql ports: - protocol: TCP nodePort: 30433 port: 9187 targetPort: 9187 - Access the following address:
- Use Secret to manage PostgreSQL passwords.
Adding a Collection Task

In the following example, metrics are collected every 30s. Therefore, you can check the reported metrics on the AOM page about 30s later.
apiVersion: monitoring.coreos.com/v1
kind: PodMonitor
metadata:
  name: postgres-exporter
  namespace: default
spec:
  namespaceSelector:
    matchNames:
      - default # Namespace where Exporter is located.
  podMetricsEndpoints:
  - interval: 30s
    path: /metrics
    port: http-metrics
  selector:
    matchLabels:
      app: postgres
Verifying that Metrics Can Be Reported to AOM
- Log in to the AOM 2.0 console.
- In the navigation pane on the left, choose Prometheus Monitoring > Instances.
- Click the Prometheus instance connected to the CCE cluster. The instance details page is displayed.
- On the Metrics tab page of the Metric Management page, select your target cluster.
- Select job {namespace}/postgres-exporter to query metrics starting with pg.
Setting a Dashboard and Alarm Rule on AOM
By setting a dashboard, you can monitor CCE cluster data on the same screen. By setting an alarm rule, you can detect cluster faults and implement warning in a timely manner.
- Setting a dashboard
- Log in to the AOM 2.0 console.
- In the navigation pane, choose Dashboard. On the displayed page, click Add Dashboard to add a dashboard. For details, see Creating a Dashboard.
- On the Dashboard page, select a Prometheus instance for CCE and click Add Graph. For details, see Adding a Graph to a Dashboard.
- Setting an alarm rule
- Log in to the AOM 2.0 console.
- In the navigation pane, choose Alarm Management > Alarm Rules.
- On the Metric/Event Alarm Rules tab page, click Create to create an alarm rule. For details, see Creating a Metric Alarm Rule.
Feedback
Was this page helpful?
Provide feedbackThank you very much for your feedback. We will continue working to improve the documentation.See the reply and handling status in My Cloud VOC.
For any further questions, feel free to contact us through the chatbot.
Chatbot


