
- What's New
- Function Overview
- Service Overview (2.0)
- Billing (2.0)
- Getting Started (2.0)
-
User Guide (2.0)
- Introduction
- Access Center
- Dashboard
- Alarm Management
- Metric Browsing
- Log Analysis (New)
- Log Analysis (Old)
- Application Insights (Retiring)
-
Prometheus Monitoring
- Prometheus Monitoring
- Creating Prometheus Instances
- Managing Prometheus Instances
- Configuring a Recording Rule
- Metric Management
- Dashboard Monitoring
- Data Multi-Write
-
Access Guide
- Connecting Node Exporter
- Connecting Self-Built Middleware in the CCE Container Scenario
-
Exporter Access in the VM Scenario
- Access Overview
- MySQL Component Access
- Redis Component Access
- Kafka Component Access
- Nginx Component Access
- MongoDB Component Access
- Consul Component Access
- HAProxy Component Access
- PostgreSQL Component Access
- Elasticsearch Component Access
- RabbitMQ Component Access
- Access of Other Components
- Custom Plug-in Access
- Other Operations
- Obtaining the Service Address of a Prometheus Instance
- Regions that Support Public Network Addresses for Remote Write
- Viewing Prometheus Instance Data Through Grafana
- Reading Prometheus Instance Data Through Remote Read
- Reporting Self-Built Prometheus Instance Data to AOM
- Resource Usage Statistics
- Business Monitoring (Beta)
- Infrastructure Monitoring
- O&M Management (Retiring)
- Settings
- Remarks
- Permissions Management
- Auditing
- Subscribing to AOM 2.0
- Upgrading to AOM 2.0
-
Best Practices (2.0)
- AOM Best Practices
- Building a Comprehensive Metric System
- Alarm Noise Reduction
- Unified Metric Monitoring
- Customizing OS Images to Automatically Connect UniAgent
- Connecting Self-Built Middleware in the CCE Container Scenario
- Interconnecting Third-Party/IDC/Huawei Cloud Cross-Region Self-Built Prometheus with AOM Prometheus Instances
-
FAQs (2.0)
- Dashboard
- Alarm Management
- Log Analysis
- Prometheus Monitoring
- Infrastructure Monitoring
- Application Monitoring
-
Collection Management
- Are ICAgent and UniAgent the Same?
- What Can I Do If an ICAgent Is Offline?
- Why Is an Installed ICAgent Displayed as "Abnormal" on the UniAgent Installation and Configuration Page?
- Why Can't I View the ICAgent Status After It Is Installed?
- Why Can't AOM Monitor CPU and Memory Usage After ICAgent Is Installed?
- How Do I Obtain an AK/SK?
- FAQs About UniAgent and ICAgent Installation
- How Do I Enable the Nginx stub_status Module?
- Why Does APM Metric Collection Fail?
- Why Cannot the Installation Script Be Downloaded When I Try to Install UniAgent on an ECS?
- CMDB (Unavailable Soon)
-
O&M Management (Unavailable Soon)
- How Can I Obtain the OBS Permission for Installing Packages?
- Why Can't Scheduled Tasks Be Triggered?
- Can I Specify Script Parameters and Hosts During Job Execution?
- Why Is a Parameter Error Displayed When I Create a Scheduled Task Using a Cron Expression?
- How Can I Set a Review for an Execution Plan?
- Why Is "delete success:{}" Displayed (Files Cannot Be Deleted) During Disk Clearance?
- What Can I Do If the Execution Plan Is Not Updated After I Modify the Job?
- What Can I Do If "agent not found" Is Displayed?
- Why Are the Hosts Listed in Execution Logs Inconsistent with Those I Configured for a Task?
- Why Did a Task Fail to Execute?
- Other FAQs
-
API Reference
- Before You Start
- API Overview
- Calling APIs
-
APIs
-
Alarm
- Querying the Event Alarm Rule List
- Adding an Event Alarm Rule
- Modifying an Event Alarm Rule
- Deleting an Event Alarm Rule
- Querying Events and Alarms
- Counting Events and Alarms
- Reporting Events and Alarms
- Obtaining the Alarm Sending Result
- Deleting a Silence Rule
- Adding a Silence Rule
- Modifying a Silence Rule
- Obtaining the Silence Rule List
- Querying an Alarm Action Rule Based on Rule Name
- Adding an Alarm Action Rule
- Deleting an Alarm Action Rule
- Modifying an Alarm Action Rule
- Querying the Alarm Action Rule List
- Querying Metric or Event Alarm Rules
- Adding or Modifying Metric or Event Alarm Rules
- Deleting Metric or Event Alarm Rules
-
Monitoring
- Querying Time Series Objects
- Querying Time Series Data
- Querying Metrics
- Querying Monitoring Data
- Adding Monitoring Data
- Adding or Modifying One or More Service Discovery Rules
- Deleting a Service Discovery Rule
- Querying Existing Service Discovery Rules
- Adding a Threshold Rule
- Querying the Threshold Rule List
- Modifying a Threshold Rule
- Deleting a Threshold Rule
- Querying a Threshold Rule
- Deleting Threshold Rules in Batches
-
Prometheus Monitoring
- Querying Expression Calculation Results in a Specified Period Using the GET Method
- (Recommended) Querying Expression Calculation Results in a Specified Period Using the POST Method
- Querying the Expression Calculation Result at a Specified Time Point Using the GET Method
- (Recommended) Querying Expression Calculation Results at a Specified Time Point Using the POST Method
- Querying Tag Values
- Obtaining the Tag Name List Using the GET Method
- (Recommended) Obtaining the Tag Name List Using the POST Method
- Querying Metadata
- Log
- Prometheus Instance
- Configuration Management
-
CMDB (AOM 2.0)
- Creating an Application
- Deleting an Application
- Querying the Details of an Application
- Modifying an Application
- Adding a Component
- Deleting a Component
- Querying the Details of a Component
- Modifying a Component
- Creating an Environment
- Deleting an Environment
- Querying the Details of an Environment
- Modifying an Environment
- Querying the Resource List of a Node
- Querying the Details of an Application Based on the Application Name
- Querying the Details of an Environment Based on the Environment Name
- Querying the Details of a Component Based on the Component Name
- Adding a Sub-application
- Deleting a Sub-application
- Modifying a Sub-application
-
Automation (AOM 2.0)
- Creating a Task
- Updating a Task
- Operating a Paused Task
- Obtaining the Execution Details of a Workflow
- Terminating a Task
- Querying a Script
- Querying the Script Version
- Performing Fuzzy Search on the Job Management Page
- Querying Execution Plans (Custom Templates) Based on Job ID
- Querying the Details of an Execution Plan
- Querying Tasks
- Querying the Execution History of a Task
- Executing a Workflow
-
Alarm
- Historical APIs
- Examples
- Permissions Policies and Supported Actions
- Appendix
- SDK Reference
-
Service Overview (1.0)
- What Is AOM?
- Product Architecture
- Functions
- Application Scenarios
- Edition Differences
-
Metric Overview
- Introduction
- Network Metrics and Dimensions
- Disk Metrics and Dimensions
- Disk Partition Metrics
- File System Metrics and Dimensions
- Host Metrics and Dimensions
- Cluster Metrics and Dimensions
- Container Metrics and Dimensions
- VM Metrics and Dimensions
- Instance Metrics and Dimensions
- Service Metrics and Dimensions
- Security
- Restrictions
- Privacy and Sensitive Information Protection Statement
- Relationships Between AOM and Other Services
- Basic Concepts
- Permissions
- Billing
- Change History
- Getting Started (1.0)
-
User Guide (1.0)
- Overview
- Subscribing to AOM
- Permissions Management
- Connecting Resources to AOM
- Monitoring Overview
- Alarm Management
- Resource Monitoring
- Log Management
- Configuration Management
- Resource Groups
- Auditing
- Upgrading to AOM 2.0
- Best Practices (1.0)
-
FAQs (1.0)
- User FAQs
-
Consultation FAQs
- What Is the Billing Policy of AOM?
- What Are the Usage Restrictions of AOM?
- What Are the Differences Between AOM and APM?
- How Do I Distinguish Alarms from Events?
- What Is the Relationship Between the Time Range and Statistical Cycle?
- Does AOM Display Logs in Real Time?
- Will Container Logs Be Deleted After They Are Dumped?
- How Can I Do If I Cannot Receive Any Email Notification After Configuring a Threshold Rule?
- Why Are Connection Channels Required?
-
Usage FAQs
- What Can I Do If I Do Not Have the Permission to Access SMN?
- What Can I Do If Resources Are Not Running Properly?
- How Do I Set the Full-Screen Online Duration?
- What Can I Do If the Log Usage Reaches 90% or Is Full?
- How Do I Obtain an AK/SK?
- How Can I Check Whether a Service Is Available?
- Why Is the Status of an Alarm Rule Displayed as "Insufficient"?
- Why the Status of a Workload that Runs Normally Is Displayed as "Abnormal" on the AOM Page?
- How Do I Create the apm_admin_trust Agency?
- How Do I Obtain the AK/SK by Creating an Agency?
- What Is the Billing Policy of Logs?
- Why Can't I See Any Logs on the Console?
- What Can I Do If an ICAgent Is Offline?
- Why Can't the Host Be Monitored After ICAgent Is Installed?
- Why Is "no crontab for root" Displayed During ICAgent Installation?
- Why Can't I Select an OBS Bucket When Configuring Log Dumping on AOM?
- Why Can't Grafana Display Content?
- Videos
-
More Documents
-
User Guide (1.0) (Kuala Lumpur Region)
-
Service Overview
- What Is AOM?
- Product Architecture
- Functions
- Application Scenarios
-
Metric Overview
- Introduction
- Network Metrics and Dimensions
- Disk Metrics and Dimensions
- Disk Partition Metrics
- File System Metrics and Dimensions
- Host Metrics and Dimensions
- Cluster Metrics and Dimensions
- Container Metrics and Dimensions
- VM Metrics and Dimensions
- Instance Metrics and Dimensions
- Service Metrics and Dimensions
- Restrictions
- Privacy and Sensitive Information Protection Statement
- Relationships Between AOM and Other Services
- Basic Concepts
- Permissions
- Getting Started
- Permissions Management
- Connecting Resources to AOM
- Monitoring Overview
- Alarm Management
- Resource Monitoring
- Log Management
- Configuration Management
- Auditing
- Upgrading to AOM 2.0
-
FAQs
- User FAQs
-
Consultation FAQs
- What Are the Usage Restrictions of AOM?
- What Are the Differences Between AOM and APM?
- How Do I Distinguish Alarms from Events?
- What Is the Relationship Between the Time Range and Statistical Cycle?
- Does AOM Display Logs in Real Time?
- How Can I Do If I Cannot Receive Any Email Notification After Configuring a Threshold Rule?
- Why Are Connection Channels Required?
-
Usage FAQs
- What Can I Do If I Do Not Have the Permission to Access SMN?
- What Can I Do If Resources Are Not Running Properly?
- How Do I Set the Full-Screen Online Duration?
- How Do I Obtain an AK/SK?
- How Can I Check Whether a Service Is Available?
- Why Is the Status of an Alarm Rule Displayed as "Insufficient"?
- Why the Status of a Workload that Runs Normally Is Displayed as "Abnormal" on the AOM Page?
- How Do I Create the apm_admin_trust Agency?
- What Can I Do If an ICAgent Is Offline?
- Why Is "no crontab for root" Displayed During ICAgent Installation?
- Change History
-
Service Overview
-
User Guide (2.0) (Kuala Lumpur Region)
- Service Overview
- Getting Started
- Introduction
- Access Center
- Dashboard
- Alarm Management
-
Metric Analysis
- Metric Browsing
- Prometheus Monitoring
- Resource Usage Statistics
- Log Analysis (Beta)
- Container Insights
- Infrastructure Monitoring
- Process Monitoring
- Collection Management
- Configuration Management
- Remarks
- Permissions Management
- Auditing
- Upgrading to AOM 2.0
-
FAQs
- Overview
- Dashboard
- Alarm Management
- Log Analysis
- Prometheus Monitoring
- Container Insights
- Application Monitoring
-
Collection Management
- Are ICAgent and UniAgent the Same?
- What Can I Do If an ICAgent Is Offline?
- Why Is an Installed ICAgent Displayed as "Abnormal" on the Agent Management Page?
- Why Can't I View the ICAgent Status After It Is Installed?
- Why Can't AOM Monitor CPU and Memory Usage After ICAgent Is Installed?
- How Do I Obtain an AK/SK?
- FAQs About ICAgent Installation
- Other FAQs
- Change History
-
API Reference (Kuala Lumpur Region)
- Before You Start
- API Overview
- Calling APIs
-
APIs
-
Alarm
- Querying the Event Alarm Rule List
- Adding an Event Alarm Rule
- Modifying an Event Alarm Rule
- Deleting an Event Alarm Rule
- Obtaining the Alarm Sending Result
- Deleting a Silence Rule
- Adding a Silence Rule
- Modifying a Silence Rule
- Obtaining the Silence Rule List
- Querying an Alarm Action Rule Based on Rule Name
- Adding an Alarm Action Rule
- Deleting an Alarm Action Rule
- Modifying an Alarm Action Rule
- Querying the Alarm Action Rule List
- Querying Events and Alarms
- Counting Events and Alarms
- Reporting Events and Alarms
-
Monitoring
- Querying Time Series Objects
- Querying Time Series Data
- Querying Metrics
- Querying Monitoring Data
- Adding Monitoring Data
- Adding or Modifying One or More Service Discovery Rules
- Deleting a Service Discovery Rule
- Querying Existing Service Discovery Rules
- Adding a Threshold Rule
- Querying the Threshold Rule List
- Modifying a Threshold Rule
- Deleting a Threshold Rule
- Querying a Threshold Rule
- Deleting Threshold Rules in Batches
- Log
-
Alarm
- Examples
- Permissions Policies and Supported Actions
- Appendix
- Change History
-
User Guide (ME-Abu Dhabi Region)
- Service Overview
- Getting Started
- User Guide
-
FAQs
- What Can I Do If an ICAgent Is Offline?
- Obtaining an AK/SK
- What Is the Relationship Between the Time Range and Statistical Cycle?
- What Can I Do If Resources Are Not Running Properly?
- How Can I Do If I Do Not Have the Permission to Access SMN?
- How Do I Distinguish Alarms and Events?
- Does AOM Display Logs in Real Time?
- How Can I Check Whether a Service Is Available?
- Why Is the Status of an Alarm Rule Displayed as "Insufficient"?
- Why the Status of a Workload that Runs Normally Is Abnormal on the AOM Page?
-
API Reference(ME-Abu Dhabi Region)
- Before You Start
- API Overview
- Calling APIs
-
APIs
-
Monitoring (v1)
- Querying Metrics
- Querying Monitoring Data
- Adding Monitoring Data
- Adding a Threshold Rule
- Modifying a Threshold Rule
- Querying the Threshold Rule List
- Querying a Threshold Rule
- Deleting a Threshold Rule
- Adding or Modifying One or More Application Discovery Rules
- Deleting an Application Discovery Rule
- Querying Application Discovery Rules
- Auto Scaling
- Log
-
Monitoring (v1)
- Permissions Policies and Supported Actions
- Appendix
-
User Guide (Ankara Region)
- Service Overview
- Getting Started
- User Guide
-
FAQs
- What Can I Do If an ICAgent Is Offline?
- How Do I Obtain an AK/SK?
- What Can I Do If Resources Are Not Running Properly?
- How Can I Do If I Do Not Have the Permission to Access SMN?
- How Do I Distinguish Alarms from Events?
- Does AOM Display Logs in Real Time?
- Why Is the Application Status Normal but the Component Status Abnormal?
- Best Practices
- Change History
-
API Reference (Ankara Region)
- Before You Start
- API Overview
- Calling APIs
-
APIs
-
Monitoring (v1)
- Querying Metrics
- Querying Monitoring Data
- Adding Monitoring Data
- Adding a Threshold Rule
- Modifying a Threshold Rule
- Querying the Threshold Rule List
- Querying a Threshold Rule
- Deleting a Threshold Rule
- Adding or Modifying One or More Application Discovery Rules
- Deleting an Application Discovery Rule
- Querying Application Discovery Rules
- Monitoring (v2)
- Auto Scaling
- Log
- Events/Alarms
- Agent
- Application Discovery Rules
-
Prometheus Monitoring
- Querying Expression Calculation Results in a Specified Period
- Querying the Expression Calculation Result at a Specified Time Point
- Querying Tag Values
- Obtaining the Tag Name List
- Querying Metadata
- Querying the Calculation Results of a PromQL Expression in a Specified Period Based on Prometheus Instance
- Querying the Calculation Result of a PromQL Expression at a Specified Time Point Based on Prometheus Instance
- Querying the Values of a Tag Based on Prometheus Instance
- Obtaining the Tag Name List Based on Prometheus Instance
- Querying Metadata Based on Prometheus Instance
-
Monitoring (v1)
- Appendix
- Change History
-
User Guide (1.0) (Kuala Lumpur Region)
- General Reference
Copied.
Connecting MySQL Exporter
Application Scenario
MySQL Exporter collects MySQL database metrics. Core database metrics collected through Exporter are used for alarm reporting and dashboard display. Currently, Exporter supports MySQL 5.6 or later. If the MySQL version is earlier than 5.6, some metrics may fail to be collected.
 NOTE:
NOTE:
You are advised to use CCE for unified Exporter management.
Prerequisites
- A CCE cluster has been created and MySQL has been installed.
- Your service has been connected for Prometheus monitoring and a CCE cluster has also been connected. For details, see Prometheus Instance for CCE.
- You have uploaded the mysql_exporter image to SoftWare Repository for Container (SWR). For details, see Uploading an Image Through a Container Engine Client.
Database Authorization
- Log in to the cluster and run the following command:
kubectl exec -it ${mysql_podname} bash
mysql -u root -p
Figure 1 Executing the command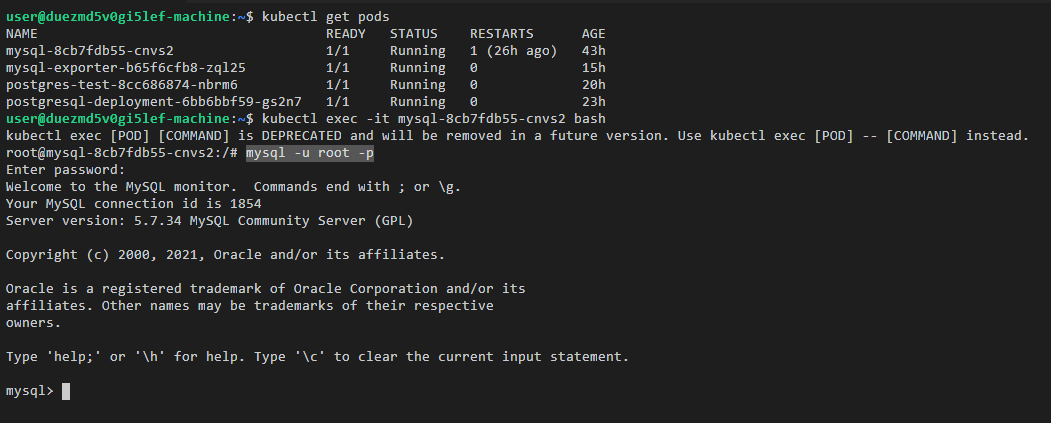
- Log in to the database and run the following command:
CREATE USER 'exporter'@'x.x.x.x(hostip)' IDENTIFIED BY 'xxxx(password)' WITH MAX_USER_CONNECTIONS 3;
GRANT PROCESS, REPLICATION CLIENT, SELECT ON *.* TO 'exporter'@'x.x.x.x(hostip)';
- Check whether the authorization is successful.
Enter the following SQL statement to check whether there is any Exporter data. host indicates the IP address of the node where the MySQL database is located.
select user,host from mysql.user;
Figure 2 SQL statement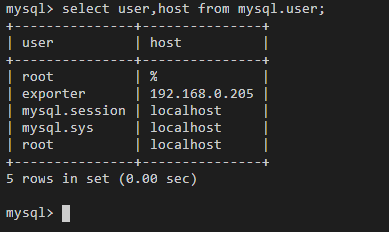
Deploying MySQL Exporter
- Log in to the CCE console.
- Click the connected cluster. The cluster management page is displayed.
- Perform the following operations to deploy Exporter:
- Use Secret to manage MySQL connection strings.
In the navigation pane, choose ConfigMaps and Secrets. In the upper right corner, click Create from YAML and enter the following .yml file. The password is encrypted based on Opaque requirements.
apiVersion: v1 kind: Secret metadata: name: mysql-secret namespace: default type: Opaque stringData: datasource: "user:password@tcp(ip:port)/" # MySQL connection string, which needs to be encrypted. - Deploy MySQL Exporter.
In the navigation pane, choose Workloads. In the upper right corner, click Create Workload. Then select the Deployment workload and select a desired namespace to deploy MySQL Exporter. YAML configuration example for deploying Exporter:
apiVersion: apps/v1 kind: Deployment metadata: labels: k8s-app: mysql-exporter # Change the name based on service requirements. You are advised to add the MySQL instance information, for example, ckafka-2vrgx9fd-mysql-exporter. name: mysql-exporter # Change the name based on service requirements. You are advised to add the MySQL instance information, for example, ckafka-2vrgx9fd-mysql-exporter. namespace: default # Must be the same as the namespace of MySQL. spec: replicas: 1 selector: matchLabels: k8s-app: mysql-exporter # Change the name based on service requirements. You are advised to add the MySQL instance information, for example, ckafka-2vrgx9fd-mysql-exporter. template: metadata: labels: k8s-app: mysql-exporter # Change the name based on service requirements. You are advised to add the MySQL instance information, for example, ckafka-2vrgx9fd-mysql-exporter. spec: containers: - env: - name: DATA_SOURCE_NAME valueFrom: secretKeyRef: name: mysql-secret key: datasource image: swr.cn-north-4.myhuaweicloud.com/aom-exporter/mysqld-exporter:v0.12.1 imagePullPolicy: IfNotPresent name: mysql-exporter ports: - containerPort: 9104 name: metric-port terminationMessagePath: /dev/termination-log terminationMessagePolicy: File dnsPolicy: ClusterFirst imagePullSecrets: - name: default-secret restartPolicy: Always schedulerName: default-scheduler securityContext: {} terminationGracePeriodSeconds: 30 --- apiVersion: v1 kind: Service metadata: name: mysql-exporter spec: type: NodePort selector: k8s-app: mysql-exporter ports: - protocol: TCP nodePort: 30337 port: 9104 targetPort: 9104 - Check whether MySQL Exporter is successfully deployed.
- On the Deployments tab page, click the Deployment created in 3.b. In the pod list, choose More > View Logs in the Operation column. The Exporter is successfully started and its access address is exposed.
- Perform verification using one of the following methods:
- Log in to a cluster node and run either of the following commands:
curl http://{Cluster IP address}:9104/metricscurl http://{Private IP address of any node in the cluster}:30337/metrics - In the instance list, choose More > Remote Login in the Operation column and run the following command:
curl http://localhost:9104/metric
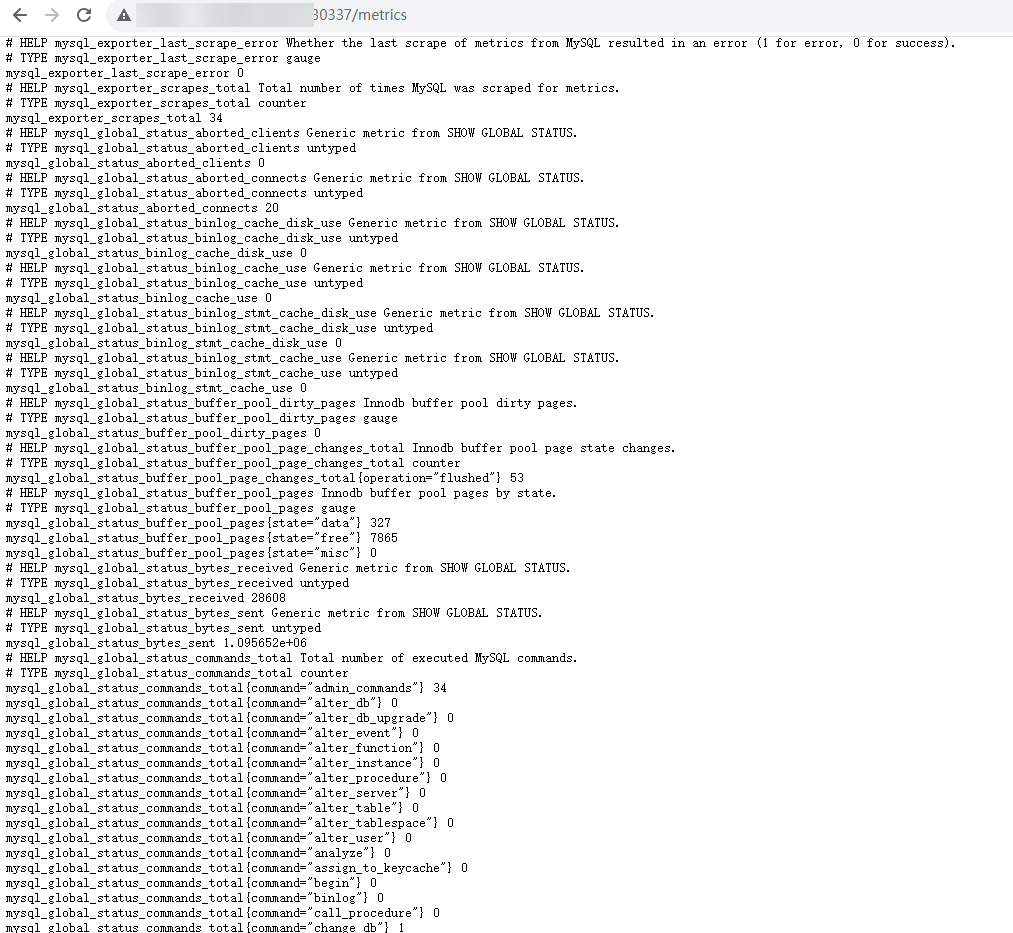
- Access http://{Public IP address of any node in the cluster}:30337/metrics.
Figure 3 Accessing a cluster node
- Log in to a cluster node and run either of the following commands:
- Use Secret to manage MySQL connection strings.
Collecting Service Data of the CCE Cluster
Add PodMonitor to configure a collection rule for monitoring the service data of applications deployed in the CCE cluster.
apiVersion: monitoring.coreos.com/v1
kind: PodMonitor
metadata:
  name: mysql-exporter
  namespace: default
spec:
  namespaceSelector:
    matchNames:
      - default # Namespace where Exporter is located.
  podMetricsEndpoints:
  - interval: 30s
    path: /metrics
    port: metric-port
  selector:
    matchLabels:
      k8s-app: mysql-exporter
NOTE:
In this example, metrics are collected every 30s. Therefore, you can check the reported metrics on the AOM page about 30s later.
Verifying that Metrics Can Be Reported to AOM
- Log in to the AOM 2.0 console.
- In the navigation pane on the left, choose Prometheus Monitoring > Instances.
- Click the Prometheus instance connected to the CCE cluster. The instance details page is displayed.
- On the Metrics tab page of the Metric Management page, select your target cluster.
- Select job {namespace}/mysql-exporter to query custom metrics starting with mysql.
Setting a Dashboard and Alarm Rule on AOM
By setting a dashboard, you can monitor CCE cluster data on the same screen. By setting an alarm rule, you can detect cluster faults and implement warning in a timely manner.
- Setting a dashboard
- Log in to the AOM 2.0 console.
- In the navigation pane, choose Dashboard. On the displayed page, click Add Dashboard to add a dashboard. For details, see Creating a Dashboard.
- On the Dashboard page, select a Prometheus instance for CCE and click Add Graph. For details, see Adding a Graph to a Dashboard.
- Setting an alarm rule
- Log in to the AOM 2.0 console.
- In the navigation pane, choose Alarm Management > Alarm Rules.
- On the Metric/Event Alarm Rules tab page, click Create to create an alarm rule. For details, see Creating a Metric Alarm Rule.
Feedback
Was this page helpful?
Provide feedbackThank you very much for your feedback. We will continue working to improve the documentation.See the reply and handling status in My Cloud VOC.
For any further questions, feel free to contact us through the chatbot.
Chatbot


