
Collecting GPU Pod Monitoring Metrics and Setting Up a Grafana Dashboard
Applications
Monitoring metrics, such as gpu_pod_core_percentage_total, gpu_pod_core_percentage_used, gpu_pod_memory_total, and gpu_pod_memory_used, for GPU pods have been added to CCE AI Suite (NVIDIA GPU) v2.1.30, v2.7.46, or later. These metrics allow for comprehensive monitoring of the compute and memory usage of a GPU card and the GPU workloads. By using these metrics, you can create monitoring dashboards at different levels (for example, by pod or node) to stay informed about cluster information in real-time. For details about GPU metrics, see GPU Metrics.
The Cloud Native Cluster Monitoring add-on does not automatically collect these metrics. To view them on Grafana dashboards, manually configure data collection in the Cloud Native Cluster Monitoring add-on and set up dashboards. This section provides an example using pod monitoring to explain how to collect GPU pod monitoring metrics and set up a dashboard.
Prerequisites
- An NVIDIA GPU node is running properly in the cluster.
- The CCE AI Suite (NVIDIA GPU) add-on has been installed in the cluster and its version is 2.1.30, 2.7.46, or later. For details about how to install the add-on, see CCE AI Suite (NVIDIA GPU).
- The Cloud Native Cluster Monitoring add-on and Grafana add-on have been installed in the cluster, and public access has been enabled for Grafana. For details about how to install these add-ons, see Cloud Native Cluster Monitoring and Grafana.
- To use AOM data sources (Configuring an AOM Data Source), enable Report Monitoring Data to AOM in the Cloud Native Cluster Monitoring add-on and Interconnect with AOM in the Grafana add-on. In addition, make sure to use the same AOM instance for both add-ons.
- To use Prometheus data sources (Configuring a Prometheus Data Source), enable Local Data Storage in the Cloud Native Cluster Monitoring add-on.
Process
| Procedure | Description | Billing |
|---|---|---|
| The Cloud Native Cluster Monitoring add-on does not automatically collect GPU pod monitoring metrics. To view these metrics in the monitoring center, manually configure data collection in the add-on. | If Report Monitoring Data to AOM is enabled for the Cloud Native Cluster Monitoring add-on, uploading GPU pod monitoring data to AOM will incur costs. For details, see Product Pricing Details. | |
| When setting up a GPU pod monitoring dashboard on the Grafana GUI, make sure to choose either the AOM or Prometheus data sources that can be properly connected to Grafana. | N/A | |
| Pod monitoring is used as an example to explain how to establish a GPU pod monitoring dashboard. | N/A |
Step 1: Collect GPU Pod Monitoring Metrics
The Cloud Native Cluster Monitoring add-on does not automatically collect GPU pod monitoring metrics. To view these metrics in the monitoring center, manually configure data collection in the add-on.
- Log in to the CCE console and click the cluster name to access the cluster console.
- In the navigation pane, choose Cluster > Settings. In the right pane, click the Monitoring tab. In the Monitoring Settings area, locate Preset Policies under Collection Settings and click Enable. In the dialog box displayed, click OK. If you have already enabled Preset Policies, skip this step.

The Preset Policies feature is used to configure preset collection policies for the Cloud Native Cluster Monitoring add-on. Enabling this feature will result in the deletion of the preset ServiceMonitor and PodMonitor policies. Any manually created collection policies will remain unaffected. Once this feature is enabled, customizing preset collection tasks becomes effortless.
Figure 1 Enabling Preset Policies
- In the Monitoring Settings area, locate Metric Settings and click Refresh to obtain data. After you enabled Preset Policies, the Cloud Native Cluster Monitoring add-on will be automatically upgraded. Then, choose Monitoring Settings > Collection Settings > Preset Policies and click Manage. In the window that slides out from the right, click the search box, select Task Name and choose nvidia-gpu-device-plugin from the drop-down list. In the Collection Metric column, click Edit Trustlist.Figure 2 Editing trustlist

- In the window that slides out from the right, click Add Metric and add gpu_pod_core_percentage_total, gpu_pod_core_percentage_used, gpu_pod_memory_total, and gpu_pod_memory_used. After completing the operation, close the page.
Step 2: Configure a Data Source for Grafana
Grafana supports:
- AOM data sources: Grafana automatically creates a prometheus-aom data source. Make sure this data source can be properly connected to Grafana.
- Prometheus data sources: You can use the preset prometheus data source in Grafana. Make sure this data source can be properly connected to Grafana.
To use an AOM data source, ensure that Report Monitoring Data to AOM has been enabled for the Cloud Native Cluster Monitoring add-on, Interconnect with AOM has been enabled for the Grafana add-on, and the two add-ons are connected to the same AOM instance. After you enabled Interconnect with AOM for the Grafana add-on, the prometheus-aom data source is automatically generated on the Grafana GUI. Ensure that the data source can be properly connected to Grafana. After the connectivity test has been passed, you can start using the AOM data source.
- In the navigation pane, choose Cluster > Add-ons. In the right pane, find the Grafana add-on and click Access to go to the Grafana GUI.
- Enter the username and password when you access the Grafana GUI for the first time. The default username and password are both admin. After entering the username and password, reset the password following instructions.
- In the upper left corner, click
 , click
  on the left of Connections, and click Data sources to access the Data sources page.
 - In the data source list, click prometheus-aom. Click Save & test at the bottom of the prometheus-aom data source page to check the data source connectivity. If "Successfully queried the Prometheus API" is displayed, the connectivity test has been passed. Figure 3 Connectivity test passed

Before using a Prometheus data source, ensure that Local Data Storage has been enabled for the Cloud Native Cluster Monitoring add-on. The Grafana prometheus data source can connect directly to the local Prometheus data source after Local Data Storage is enabled. Ensure that the data source can be properly connected to Grafana. After the connectivity test has been passed, you can start using the Prometheus data source.
- In the navigation pane, choose Cluster > Add-ons. In the right pane, find the Grafana add-on and click Access to go to the Grafana GUI.
- Enter the username and password when you access the Grafana GUI for the first time. The default username and password are both admin. After entering the username and password, reset the password following instructions.
- In the upper left corner, click , click on the left of Connections, and click Data sources to access the Data sources page.
- In the data source list, click prometheus. Click Save & test at the bottom of the prometheus data source page to check the data source connectivity. If "Successfully queried the Prometheus API" is displayed, the connectivity test has been passed. Figure 4 Connectivity test passed

Step 3: Set Up a Grafana Dashboard
Grafana dashboards are essential for centralized monitoring and visualizing data from various data sources. They provide real-time insights into system statuses and service metrics using charts, graphs, and alarms. Grafana can generate monitoring dashboards based on GPU pod metrics, categorizing them by pod, GPU, node, and cluster. This section describes how to set up a Grafana dashboard for pods as an example. Additional PromQL statements for different monitoring panels are available in PromQL Statement. You can perform the following operations to set up related dashboards.
- Set up a Grafana dashboard to show GPU pod monitoring metrics.
- On the Grafana GUI, click
 to open the menu bar on the left and click Dashboards. In the upper right corner of the Dashboards page, click New and choose New dashboard from the drop-down list. Figure 5 Setting up a dashboard
- In the upper right corner of the New dashboard page, click
 to name the dashboard. Enter GPU Pod Dashboard for Title and click Save dashboard in the upper right corner. On the Save dashboard page displayed, click Save. In this example, the dashboard is named GPU Pod Dashboard. You can use another name. Figure 6 Renaming a dashboard
- On the Grafana GUI, click
- Configure variables for the Grafana dashboard. Grafana variables allow you to create dynamic, customizable, templated dashboards. By changing variable values within a dashboard, you can modify the queries and panels. There is no need to create separate dashboards for each service or metric. Table 1 outlines the variables in this example. Using instance as an example, this step shows how to configure variables for a Grafana dashboard. You can refer to the instance example to add the variables listed in Table 1.
Table 1 Variables Variable
Description
PromQL Statement
instance
Pod name of dp. It is used to obtain GPU nodes.
label_values(up{job=~".*nvidia-gpu-device-plugin.*"},instance)
gpu_index
GPU card number, for example, 0, 1, or 2
label_values(cce_gpu_temperature{instance=~"$instance"}, gpu_index)
namespace
Namespace where a GPU workload is in
label_values(gpu_pod_memory_used{instance=~"$instance",gpu_index=~"$gpu_index"}, namespace)
pod
Pod name of a GPU workload
label_values(gpu_pod_memory_used{instance=~"$instance",gpu_index=~"$gpu_index",namespace=~"$namespace"}, pod)
- In the upper right corner of the New dashboard page, click
 . On the Settings page, click the Variables tab and click Add variable. Figure 7 Adding a variable
- Configure Select variable type and General. For details, see Figure 8 and Table 2.
Table 2 Configuration example for Select variable type and General Parameter
Example Value
Description
Select variable type
Query
Choose a variable type and select Query to obtain the values of variables in Table 1 from data source queries.
Name
instance
Configure a variable name.
- Configure Query options. For details, see Figure 9 and Table 3.
Table 3 Configuration example for Query options Parameter
Example Value
Description
Query type
Classic query
Select the data query mode and display mode.
In this example, select Classic query, which is a text-based query mode where you can write query statements (such as PromQL) directly to retrieve data.
Classic Query
label_values(up{job=~".*nvidia-gpu-device-plugin.*"},instance)
Enter a Prometheus query statement.
The query statement in this example is used to get the up metrics whose job labels contain nvidia-gpu-device-plugin from Prometheus and extract the instance label values of these metrics.
Sort
Alphabetical (asc)
Select the sorting mode of variable values. You can select a value as needed.
In this example, Alphabetical (asc) is selected, meaning the records are sorted in ascending alphabetical order.
Refresh
On time range change
Manage the update timing of variable values to specify when they are retrieved and refreshed from a data source. You can select a value as needed.
In this example, On time range change is selected, meaning variable values are fetched from the data source again after the dashboard's time window changes.
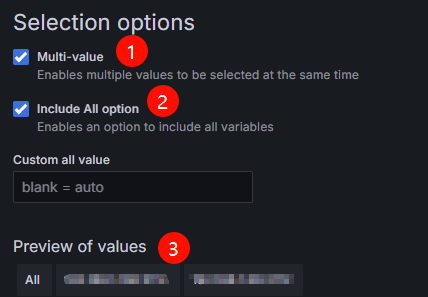
- Configure Selection options. For details, see Figure 10 and Table 4.
Table 4 Configuration example for Selection options Parameter
Example Value
Description
Multi-value
Selected
After this function is enabled, you can select multiple values of a variable.
Include All option
Selected
After this function is enabled, the All option is added to the variable drop-down list, allowing you to select all values with just one click.
Preview of values
-
Variable value of instance. It is the pod name of dp.
Repeat the preceding steps to add variables listed in Table 1. After the variables are configured,
 appears on the right of the variables, showing a message that indicates the variables are not being referenced. These variables will be referenced when you configure the monitoring panel.
 - Click Save dashboard in the upper right corner. On the Save dashboard page displayed, click Save to save the variables.
- In the upper right corner of the New dashboard page, click
- Configure the Grafana monitoring panels.
Table 5 lists the example monitoring panels to describe how to create different types of monitoring panels. You can set up different monitoring panels as needed. For details, see Table 6.
Table 5 Monitoring panels Panel Name
Description
Panel Type
Total Pods
The total number of GPU pods running on non-sharable GPUs
Stat
Pod Details
Summary of information such as the pod names, allocated GPU memory, and used GPU memory in a table
Table
Pod GPU Memory Allocation
The amount of GPU memory allocated to pods of the GPU workloads
Bar gauge
Pod GPU Memory Allocation Usage Rate
The usage of GPU memory allocated to pods of the GPU workloads
Gauge
Example of Stat Visualization: Total Pods
- In the upper left corner of the current page, click GPU Pod Dashboard, click Add on the right, and choose Visualization from the drop-down list to create a panel.
- On the Query tab in the lower left corner of the Edit panel page, select the data source configured in Step 2: Configure a Data Source for Grafana for Data source. Click
 on the left of A, click Code on the right of the expanded content, and enter the corresponding PromQL statement in Metrics browser to collect data. For details about PromQL statements, see Table 6. Figure 11 Entering a PromQL statement
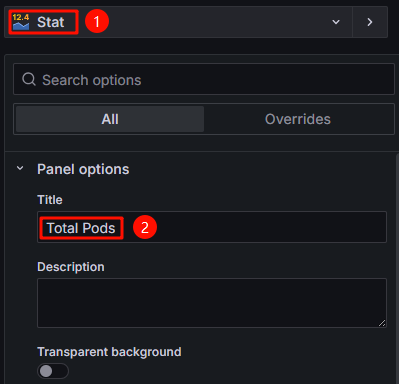
- In the upper right corner, switch the panel type to Stat and enter a panel title in Panel options > Title. In this example, the title is set to Total Pods. You can use another title. Figure 12 Configuring the panel type and title
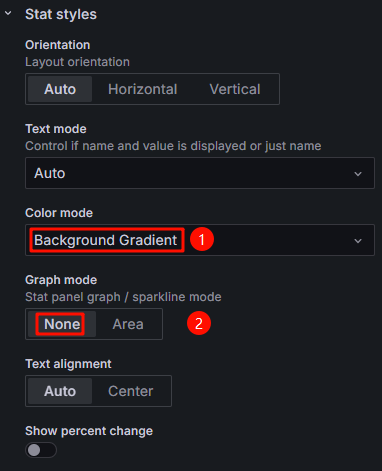
- Configure the color mode and graph mode in Stat styles. In this example, Color mode is set to Background Gradient and Graph mode is set to None. You can select other values for them. Figure 13 Configuring Stat styles
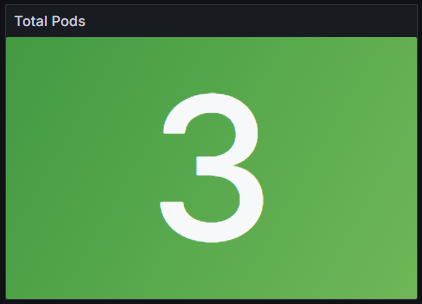
- Click Save in the upper right corner. On the Save dashboard page displayed, click Save again. In the upper right corner, click Apply to go to the dashboard page. The Total Pods panel has been created. It shows 3, which means that there are three pods in the cluster. Figure 14 Checking the total number of pods
Example of Table Visualization: Pod Details
- On the right, click Add and choose Visualization from the drop-down list to create a panel.
- In the upper right corner of the Edit panel page, switch the panel type to Table and enter a panel title in Panel options > Title. In this example, the title is set to Pod Details. You can use another title.
- In the lower left corner of the Query tab, click Add query twice and enter three PromQL statements in Metrics browser of A, B, and C in order. For details about PromQL statements, see Table 6. Figure 15 Entering the PromQL statements

In the Options of A, B, and C, set Format to Table and Type to Instant. This setting will display the query results in a table and retrieve only the data at the current time point.
Figure 16 Changing the display mode and query mode of query results
- Switch to the Transform data tab, click Add transformation, and select Merge series/tables to merge the added PromQL statements. Figure 17 Configuring Merge series/tables

- In the lower part of the Transform data tab, click Add another transformation and select Organize fields by name to configure the table header. Additionally, Organize fields by name supports column hiding, column sequence adjustment, and column name setting. For details, see Figure 19. You can customize the settings. Figure 18 Configuring Organize fields by name

- Click Save in the upper right corner. On the Save dashboard page displayed, click Save again. In the upper right corner, click Apply to go to the dashboard page. The Pod Details panel has been created. Figure 20 Checking pod details

Example of Bar Gauge Visualization: GPU Memory Allocated to Pods
- On the right, click Add and choose Visualization from the drop-down list to create a panel.
- In the lower left corner of the Edit panel page, enter a PromQL statement in Metrics browser of A. For details about PromQL statements, see Table 6. After entering the PromQL statement, select Custom in Options > Legend and enter {{Pod}}. This operation is used to replace the label in the legend with the value of the variable pod. Figure 21 Adding a PromQL statement

- In the upper right corner, switch the panel type to Bar gauge and enter a panel title in Panel options > Title. In this example, the title is set to Pod GPU Memory Allocation. You can use another title.
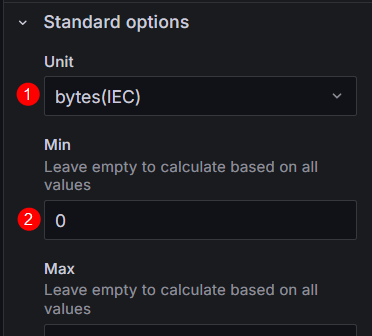
- In Standard options, set Unit to Data > bytes (IEC) to convert the data unit to GiB and set Min to 0 to display data more intuitively. Figure 22 Configuring Standard options
- Click Save in the upper right corner. On the Save dashboard page displayed, click Save again. In the upper right corner, click Apply to go to the dashboard page. The Pod GPU Memory Allocation panel has been created. Figure 23 Checking the pod GPU memory allocation

Dashboard Panel Example: The Usage of GPU Memory Allocated to Pods
- On the right, click Add and choose Visualization from the drop-down list to create a panel.
- In the lower left corner of the Edit panel page, enter a PromQL statement in Metrics browser of A. For details about PromQL statements, see Table 6. After entering the PromQL statement, select Custom in Options > Legend and enter {{Pod}}. This operation is used to replace the label in the legend with the value of the variable pod. Figure 24 Modifying a legend label

- In the upper right corner, switch the panel type to Gauge and enter a panel title in Panel options > Title. In this example, the title is set to Pod GPU Memory Allocation Usage Rate. You can use another title.
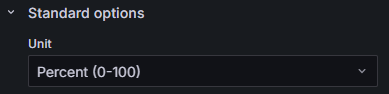
- In Standard options, set Unit to Misc > Percent (0-100) to convert the data unit to percentage ranging from 0% to 100%. Figure 25 Changing data unit
- Click Save in the upper right corner. On the Save dashboard page displayed, click Save again. In the upper right corner, click Apply to go to the dashboard page. The Pod GPU Memory Allocation Usage Rate panel has been created. Figure 26 Checking the usage of GPU memory allocated to pods


PromQL Statement
This section provides PromQL statements for each monitoring panel for different purposes. You can use these statements to create different Grafana dashboards.
If the allocated GPU memory or compute is 0, calculating their utilization is meaningless. The PromQL statements here exclude cases where GPU memory or compute allocation is 0 when calculating their utilization.
| Panel Name | PromQL Statement |
|---|---|
| Total Pods | count(avg by (instance,pod,container,pod,container,namespace)(gpu_pod_memory_total{instance=~"$instance",gpu_index=~"$gpu_index",namespace=~"$namespace",pod=~"$pod",pod!=""})) |
| Pod Details | sum by (instance,pod,container,namespace)(gpu_pod_memory_total{instance=~"$instance",gpu_index=~"$gpu_index",namespace=~"$namespace",pod=~"$pod",pod!=""}) /1024/1024/1024 |
| sum by (instance,pod,container,namespace)(gpu_pod_memory_used{instance=~"$instance",gpu_index=~"$gpu_index",namespace=~"$namespace",pod=~"$pod",pod!=""}) /1024/1024/1024 | |
| avg by (instance,pod,container,namespace,xgpu_index) (xgpu_memory_total{pod!=""}) | |
| Pod GPU Memory Allocation | sum by (instance,pod,container,pod,container,namespace)(gpu_pod_memory_total{instance=~"$instance",gpu_index=~"$gpu_index",namespace=~"$namespace",pod=~"$pod",pod!=""}) |
| Used GPU Memory of Pods | sum by (instance,pod,container,pod,container)(gpu_pod_memory_used{instance=~"$instance",gpu_index=~"$gpu_index",namespace=~"$namespace",pod=~"$pod",pod!=""}) |
| Pod GPU Memory Allocation Usage Rate | sum by (instance,pod,container,pod,container)(gpu_pod_memory_used{instance=~"$instance",gpu_index=~"$gpu_index",namespace=~"$namespace",pod=~"$pod",pod!=""})/sum by (instance,pod,container,pod,container)(gpu_pod_memory_total{instance=~"$instance",gpu_index=~"$gpu_index",namespace=~"$namespace",pod=~"$pod",pod!=""}!=0) * 100 |
| GPU Compute Allocated to Pods | sum by (instance,pod,container,pod,container)(gpu_pod_core_percentage_total{instance=~"$instance",gpu_index=~"$gpu_index",namespace=~"$namespace",pod=~"$pod",pod!=""}) |
| Used GPU Compute of Pods | sum by (instance,pod,container,pod,container)(gpu_pod_core_percentage_used{instance=~"$instance",gpu_index=~"$gpu_index",namespace=~"$namespace",pod=~"$pod",pod!=""}) |
| Usage of GPU Compute Allocated to Pods | sum by (instance,pod,container,pod,container)(gpu_pod_core_percentage_used{instance=~"$instance",gpu_index=~"$gpu_index",namespace=~"$namespace",pod=~"$pod",pod!=""})/sum by (instance,pod,container,pod,container)(gpu_pod_core_percentage_total{instance=~"$instance",gpu_index=~"$gpu_index",namespace=~"$namespace",pod=~"$pod",pod!=""}!=0) * 100 |
| Panel Name | PromQL Statement |
|---|---|
| Total GPUs | count(avg by (instance,gpu_index)(cce_gpu_temperature{instance=~"$instance",gpu_index=~"$gpu_index",namespace=~"$namespace",pod=~"$pod"})) |
| GPU Details | avg by (instance,gpu_index,gpu_id,modelName)(cce_gpu_memory_total{instance=~"$instance",gpu_index=~"$gpu_index",namespace=~"$namespace",pod=~"$pod"}) /1024/1024/1024 |
| sum by (instance,gpu_index,gpu_id,modelName)(gpu_pod_memory_total{instance=~"$instance",gpu_index=~"$gpu_index",namespace=~"$namespace",pod=~"$pod",pod!=""}) /1024/1024/1024 | |
| Allocated GPU Memory | sum by (instance,gpu_index)(gpu_pod_memory_total{instance=~"$instance",gpu_index=~"$gpu_index",namespace=~"$namespace",pod=~"$pod",pod!=""}) |
| Used GPU Memory | sum by (instance,gpu_index)(gpu_pod_memory_used{instance=~"$instance",gpu_index=~"$gpu_index",namespace=~"$namespace",pod=~"$pod",pod!=""}) |
| Usage of Allocated GPU Memory | sum by (instance,gpu_index)(gpu_pod_memory_used{instance=~"$instance",gpu_index=~"$gpu_index",namespace=~"$namespace",pod=~"$pod",pod!=""})/sum by (instance,gpu_index)(gpu_pod_memory_total{instance=~"$instance",gpu_index=~"$gpu_index",namespace=~"$namespace",pod=~"$pod",pod!=""}!=0) * 100 |
| Total GPU Memory | avg by (instance,gpu_index)(cce_gpu_memory_total{instance=~"$instance",gpu_index=~"$gpu_index",namespace=~"$namespace",pod=~"$pod"}) |
| Allocated GPU Compute | sum by (instance,gpu_index)(gpu_pod_core_percentage_total{instance=~"$instance",gpu_index=~"$gpu_index",namespace=~"$namespace",pod=~"$pod",pod!=""}) |
| Used GPU Compute | sum by (instance,gpu_index)(gpu_pod_core_percentage_used{instance=~"$instance",gpu_index=~"$gpu_index",namespace=~"$namespace",pod=~"$pod",pod!=""}) |
| Usage of Allocated GPU Compute | sum by (instance,gpu_index)(gpu_pod_core_percentage_used{instance=~"$instance",gpu_index=~"$gpu_index",namespace=~"$namespace",pod=~"$pod",pod!=""})/sum by (instance,gpu_index)(gpu_pod_core_percentage_total{instance=~"$instance",gpu_index=~"$gpu_index",namespace=~"$namespace",pod=~"$pod",pod!=""}!=0) * 100 |
| Total GPU Compute | count by (instance, gpu_index) (avg by (instance,gpu_index)(cce_gpu_temperature{instance=~"$instance",gpu_index=~"$gpu_index",namespace=~"$namespace",pod=~"$pod"})) * 100 |
| Panel Name | PromQL Statement |
|---|---|
| Total GPU Nodes | count(avg by (instance)(cce_gpu_temperature{instance=~"$instance",gpu_index=~"$gpu_index",namespace=~"$namespace",pod=~"$pod"})) |
| GPU Node Details | avg by (instance)(cce_gpu_memory_total{instance=~"$instance",gpu_index=~"$gpu_index",namespace=~"$namespace",pod=~"$pod"}) /1024/1024/1024 |
| sum by (instance)(gpu_pod_memory_total{instance=~"$instance",gpu_index=~"$gpu_index",namespace=~"$namespace",pod=~"$pod",pod!=""}) /1024/1024/1024 | |
| GPU Memory Allocated to Nodes | sum by (instance)(gpu_pod_memory_total{instance=~"$instance",gpu_index=~"$gpu_index",namespace=~"$namespace",pod=~"$pod",pod!=""}) |
| Used GPU Memory of Nodes | sum by (instance)(gpu_pod_memory_used{instance=~"$instance",gpu_index=~"$gpu_index",namespace=~"$namespace",pod=~"$pod",pod!=""}) |
| Usage of GPU Memory Allocated to Nodes | sum by (instance)(gpu_pod_memory_used{instance=~"$instance",gpu_index=~"$gpu_index",namespace=~"$namespace",pod=~"$pod",pod!=""})/sum by (instance)(gpu_pod_memory_total{instance=~"$instance",gpu_index=~"$gpu_index",namespace=~"$namespace",pod=~"$pod",pod!=""}!=0) * 100 |
| Total GPU Memory of Nodes | sum by (instance) (avg by (instance,gpu_index)(cce_gpu_memory_total{instance=~"$instance",gpu_index=~"$gpu_index",namespace=~"$namespace",pod=~"$pod"})) |
| GPU Compute Allocated to Nodes | sum by (instance)(gpu_pod_core_percentage_total{instance=~"$instance",gpu_index=~"$gpu_index",namespace=~"$namespace",pod=~"$pod",pod!=""}) |
| Used GPU Compute of Nodes | sum by (instance)(gpu_pod_core_percentage_used{pod!=""}) |
| Usage of GPU Compute Allocated to Nodes | sum by (instance)(gpu_pod_core_percentage_used{pod!=""})/sum by (instance)(gpu_pod_core_percentage_total{pod!=""}!=0) * 100 |
| Total GPU Compute of Nodes | count by (instance) (avg by (instance,gpu_index)(cce_gpu_temperature)) * 100 |
| Panel Name | PromQL Statement |
|---|---|
| GPU Memory Allocated to Clusters | sum (gpu_pod_memory_total{pod!=""}) |
| Used GPU Memory of Clusters | sum (gpu_pod_memory_used{instance=~"$instance",gpu_index=~"$gpu_index",namespace=~"$namespace",pod=~"$pod",pod!=""}) |
| Usage of GPU Memory Allocated to Clusters | sum (gpu_pod_memory_used{instance=~"$instance",gpu_index=~"$gpu_index",namespace=~"$namespace",pod=~"$pod",pod!=""})/sum (gpu_pod_memory_total{instance=~"$instance",gpu_index=~"$gpu_index",namespace=~"$namespace",pod=~"$pod",pod!=""}) * 100 |
| Total GPU Memory of Clusters | sum (avg by (instance,gpu_index)(cce_gpu_memory_total{instance=~"$instance",gpu_index=~"$gpu_index",namespace=~"$namespace",pod=~"$pod"})) |
| GPU Compute Allocated to Clusters | sum (gpu_pod_core_percentage_total{instance=~"$instance",gpu_index=~"$gpu_index",namespace=~"$namespace",pod=~"$pod",pod!=""}) |
| Used GPU Compute of Clusters | sum (gpu_pod_core_percentage_used{instance=~"$instance",gpu_index=~"$gpu_index",namespace=~"$namespace",pod=~"$pod",pod!=""}) |
| Usage of GPU Compute Allocated to Clusters | sum (gpu_pod_core_percentage_used{instance=~"$instance",gpu_index=~"$gpu_index",namespace=~"$namespace",pod=~"$pod",pod!=""})/sum (gpu_pod_core_percentage_total{instance=~"$instance",gpu_index=~"$gpu_index",namespace=~"$namespace",pod=~"$pod",pod!=""}) * 100 |
| Total GPU Compute of Clusters | count(avg by (instance,gpu_index)(cce_gpu_temperature{instance=~"$instance",gpu_index=~"$gpu_index",namespace=~"$namespace",pod=~"$pod"})) * 100 |
Feedback
Was this page helpful?
Provide feedbackThank you very much for your feedback. We will continue working to improve the documentation.See the reply and handling status in My Cloud VOC.
For any further questions, feel free to contact us through the chatbot.
Chatbot


