Searching and Analyzing Logs
LTS enables you to search and analyze logs simultaneously using a statement that includes a pipe character (|). The syntax consists of three parts: a statement for searching unstructured and semi-structured data, a pipe character (|), and a statement for analyzing structured data, for example, * and msg:"hello world" | SELECT avg(value).
Log Search and Analysis
- On the LTS console, choose Log Management in the navigation pane.
- In the log group list, click
 on the left of a log group name.
 - In the log stream list, click the name of the target log stream.
Figure 1 Log search tab page
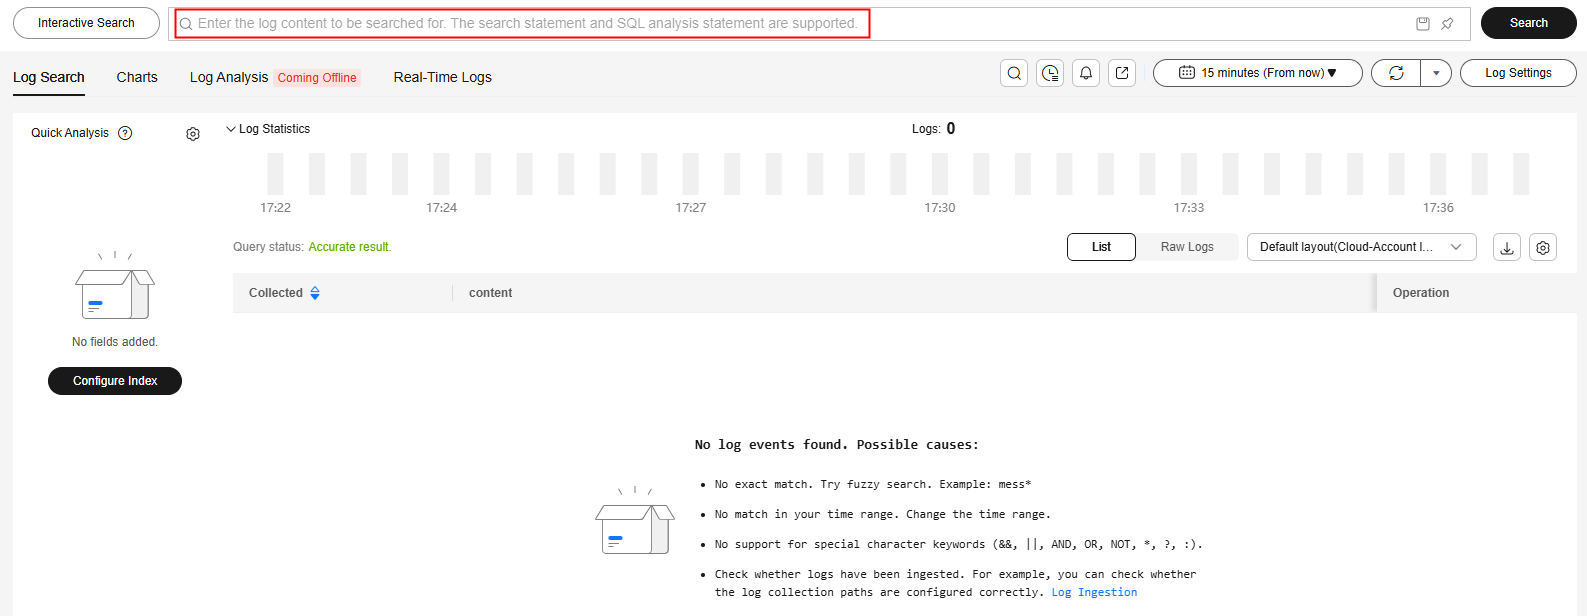
- In the log content area, you can select a list or raw log to display its log content.
The log highlighting mechanism works as follows: Once a log meets the search criteria, the system identifies the log's strings that match these criteria and applies highlight tags to the matching sections, making them visibly highlighted on the page. However, when the query criteria are complex, particularly involving OR relationships, content that does not actually match the criteria may also be highlighted on the page.
If raw logs are not uploaded, Chinese characters may not be highlighted during full-text search. To highlight Chinese characters in a field (for example, field1), use this format: field1:Chinese keyword.
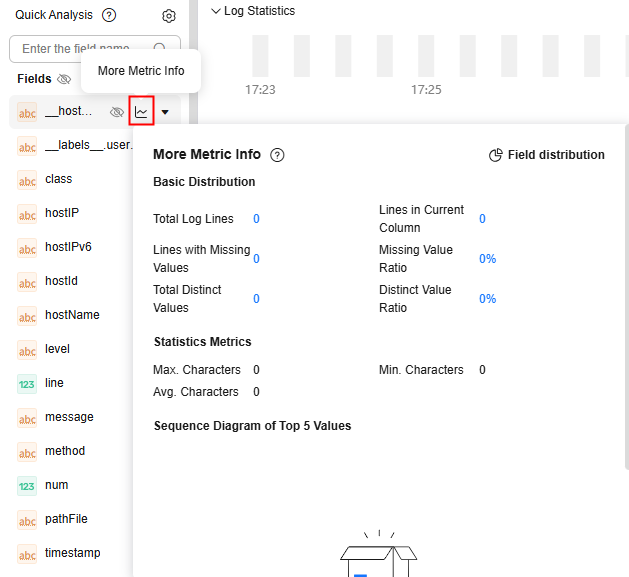
- On the Log Search tab page, view the structuring fields and index fields under Quick Analysis. You can click
 next to a field to view the metric information. For details, see Creating a Quick Analysis Task.
Figure 2 Structuring fields
- When you search through a large amount of log data on the Log Search tab page, LTS automatically initiates an iterative search.
- During an iterative log search, you cannot enter any information in the search box. To pause the iterative search, click Pause. To resume the search, click Continue. You are advised not to initiate a new search task before the current iterative search is complete.
- For iterative searches that take a long time, you can narrow down the time range or add filters to reduce the number of iterative searches.
- On the Charts tab page, select a time range in the upper right corner to view raw logs and statistical charts. Enter a search statement and a SQL analysis statement, separated by the pipe character (|), in the search box. For details, see SQL Functions.
Figure 3 Time range
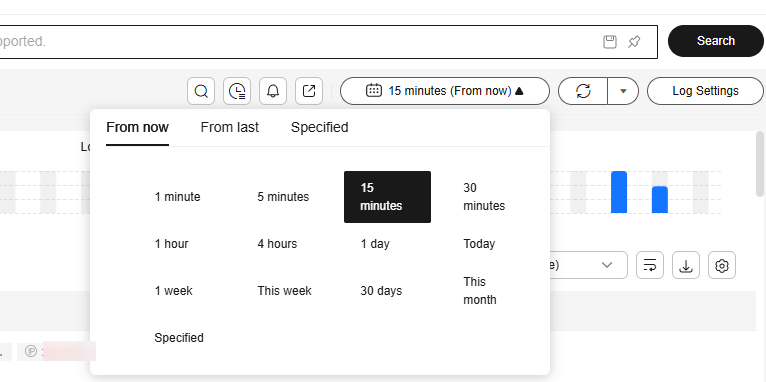
There are three types of time range: relative time from now, relative time from last, and specified time. Select a time range as required.
- From now: queries log data generated in a time range that ends with the current time, such as the previous 1, 5, or 15 minutes. For example, if the current time is 19:20:31 and 1 hour is selected as the relative time from now, the charts on the dashboard display the log data that is generated from 18:20:31 to 19:20:31.
- From last: queries log data generated in a time range that ends with the current time, such as the previous 1 or 15 minutes. For example, if the current time is 19:20:31 and 1 hour is selected as the relative time from last, the charts on the dashboard display the log data that is generated from 18:00:00 to 19:00:00.
- Specified: queries log data that is generated in a specified time range.
- Set the layout of log data, including whether to display fields or display fields in a simple view.
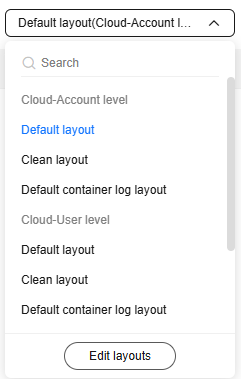
- Select Edit layouts from the layout drop-down list to access the layout setting page. The list also contains options such as the default layout, pure layout, and default container log layout, for you to set whether to display fields.
Figure 4 Editing layouts
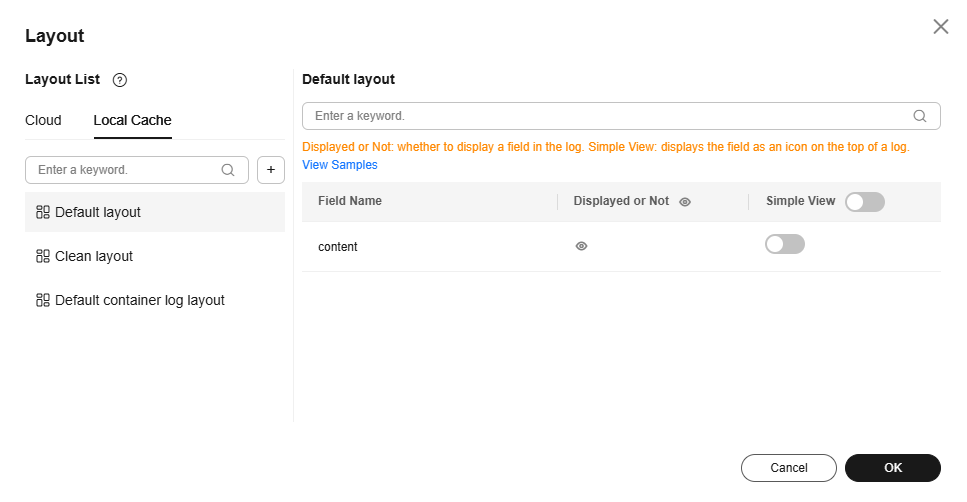
- Cloud: This mode is applicable to users who have the write permission. Layout information is stored on the cloud. You can set the layout configuration at the account or user level.
- Local Cache: This mode is applicable to users who have only the read permission. Layout information is cached in the local browser.
- On the displayed Layout page, click + under Layout List to create a custom layout, name it, and configure how fields are displayed in this layout.
Figure 5 Layout settings
You can perform the following operations on a new layout:
- Edit: Click
 to edit the layout's display name.
 - Copy: Hover the cursor over
 , select Copy To Local Cache, Copy To Cloud-Account level, or Copy To Cloud-User level, and click OK.
 - Delete: Click
 and then Yes to delete the layout.

Deleted layouts cannot be restored. Exercise caution when performing this operation.
- Edit: Click
- After the setting is complete, click OK. The new custom layout is displayed in the drop-down list.
- Select Edit layouts from the layout drop-down list to access the layout setting page. The list also contains options such as the default layout, pure layout, and default container log layout, for you to set whether to display fields.
- On the Log Search tab page, configure the column display settings.
- Choose List to display logs in a list, hover the cursor over
 , and click Set Columns. On the displayed page, set the columns to be displayed.
 - By default, the display of the time column and content column is enabled. All visible field names are listed under Displayed Columns. You can set aliases for fields. Properly configured aliases can make your logs easier to read and maintain, improving query efficiency. Click OK.
- You can display or hide fields as described in Creating a Quick Analysis Task or 8.
- Choose List to display logs in a list, hover the cursor over
Interactive Mode
Before using the interactive mode function, ensure that logs are properly reported and structured, and indexing have been configured. For details, see Using ICAgent to Collect Host Logs and Configuring Log Indexing.
If you have not configured ICAgent structuring parsing when configuring log ingestion to LTS, you can configure ICAgent or cloud configuring parsing for the target log stream separately. ICAgent structuring parsing is recommended. For details, see Configuring ICAgent Structuring Parsing.
The interactive search and analysis function generates simple analysis statements, allowing you to set search criteria and specify query filter rules on the LTS console to filter log events. For more functions or nested queries, enter SQL statements manually. For details, see SQL Functions.
- Click Interactive Search in front of the search box. On the displayed page, you can set log search and analysis.
Figure 6 Interactive mode
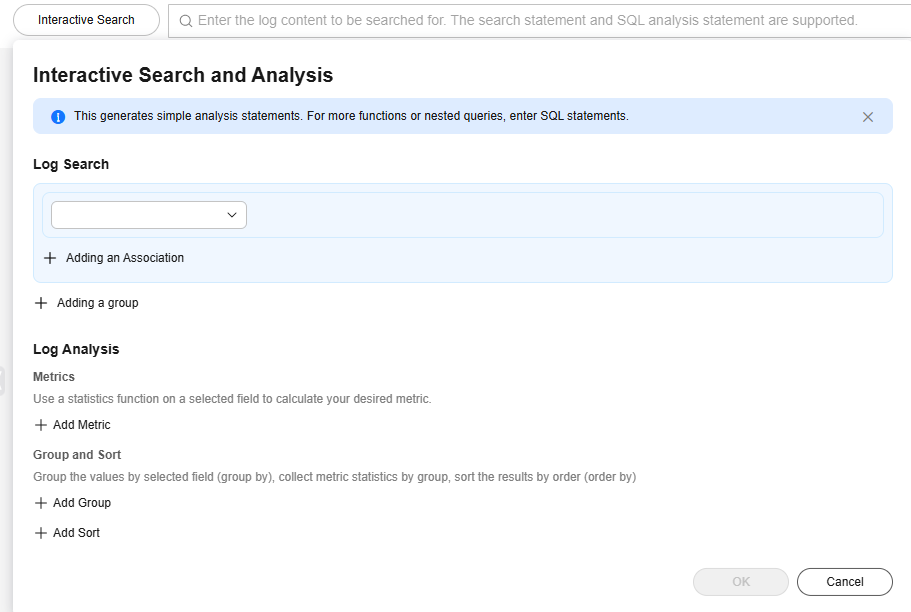
- Select the log search field and criteria from the drop-down list under Log Search. The corresponding values of the field will be displayed in the search box. Add associations or groups to customize your search mode.
- The drop-down list displays index fields, structuring fields, and system reserved fields.
- And indicates that all conditions must be met.
- Or indicates that only one of the conditions needs to be met.
For example, you can select fields such as content, hostId, and pathFile and set different conditions. Then you can preview the search statement at any time and modify the search conditions with ease.
- Set analysis rules under Log Analysis.
- Click Add Metric and select a statistics function for a selected field to calculate your desired metric.
- Add Group: Group the values by selected field (group by), collect metric statistics by group, and sort the results by order (order by).
Click Add Group and Add Sort to set the group information and sorting of the fields.
- You can set search criteria as required and preview search statements and modify the search criteria at any time. After the setting is complete, click OK. You can then view the analysis result on the Charts tab page. For details, see Visualizing Logs in Statistical Charts.
Common Log Search Operations
These operations include sharing logs and refreshing logs. For details, see Table 1.
|
Operation |
Description |
|---|---|
|
Creating a quick search |
Click |
|
Viewing dashboards |
Click |
|
Adding alarm rules |
Click |
|
Sharing logs |
Click |
|
Refreshing logs |
You can click
|
|
Copying logs |
Click |
|
Viewing context of a log |
Click You can select Simple View to view the log context. You can also download the context. |
|
More operations |
Click
|
|
Unfold/Fold |
Click |
|
Downloading logs |
You can download log files or log query and analysis results to your local PC. To avoid downloading empty files, ensure that raw logs have been uploaded to the current log stream.
|
|
Hiding/Expanding all |
Click |
|
JSON |
Move the cursor over Formatting is enabled by default. The default number of expanded levels is 2. If a log contains multiple backslashes, the first backslash will be lost when the log is displayed in JSON format because it will be processed as an escape character during JSON parsing.
|
|
Collapse configuration |
Move the cursor over If the number of characters in a log exceeds the maximum, the extra characters will be hidden. Click Expand to view all. Logs are collapsed by default, with a default character limit of 400. |
|
Log time display |
Move the cursor over |
|
Invisible fields ( |
This list displays the invisible fields configured in the layout settings.
|
Helpful Links
- You can use the log alarm function of LTS to set alarm rules to notify you of exceptions in the ingested logs. For details, see Configuring Log Alarm Rules.
- If you have any questions during log search, see Log Search and Analysis in the FAQ.
- For best practices of log search and analysis, see Log Search and Analysis in the Best Practices.
- You can analyze ingested WAF logs on the LTS console. For details, see Analyzing Huawei Cloud WAF Logs on LTS.
- You can embed the log query page of LTS into your system. For details, see Embedding the LTS Log Query Page into a User-built System.
Feedback
Was this page helpful?
Provide feedbackThank you very much for your feedback. We will continue working to improve the documentation.See the reply and handling status in My Cloud VOC.
For any further questions, feel free to contact us through the chatbot.
Chatbot


