Component OOM of the Cloud Native Cluster Monitoring Add-on
The Cloud Native Cluster Monitoring add-on in a cluster may have OOM errors when the cluster is running. This section describes how to handle OOM errors.
If the components of this add-on have OOM errors, refer to:
- prometheus-lightweight OOM
- prometheus-server OOM
- thanos-query and thanos-sidecar OOM
- kube-state-metrics OOM
Preparations
Ensure that the memory of the node where workloads are deployed is sufficient to prevent OOM caused by insufficient node memory.
prometheus-lightweight OOM

prometheus-lightweight exists only when the local storage is disabled.
prometheus-lightweight is a lightweight collection component. Generally, there is no OOM error. If there is an OOM error, the remote storage (AOM or third-party storage) may be abnormal. You are advised to view the logs and dashboard of prometheus-lightweight.
- Go to the StatefulSets tab (Workloads > StatefulSets), select the monitoring namespace, locate prometheus-lightweight, and click View Log in the Operation column to locate the fault.

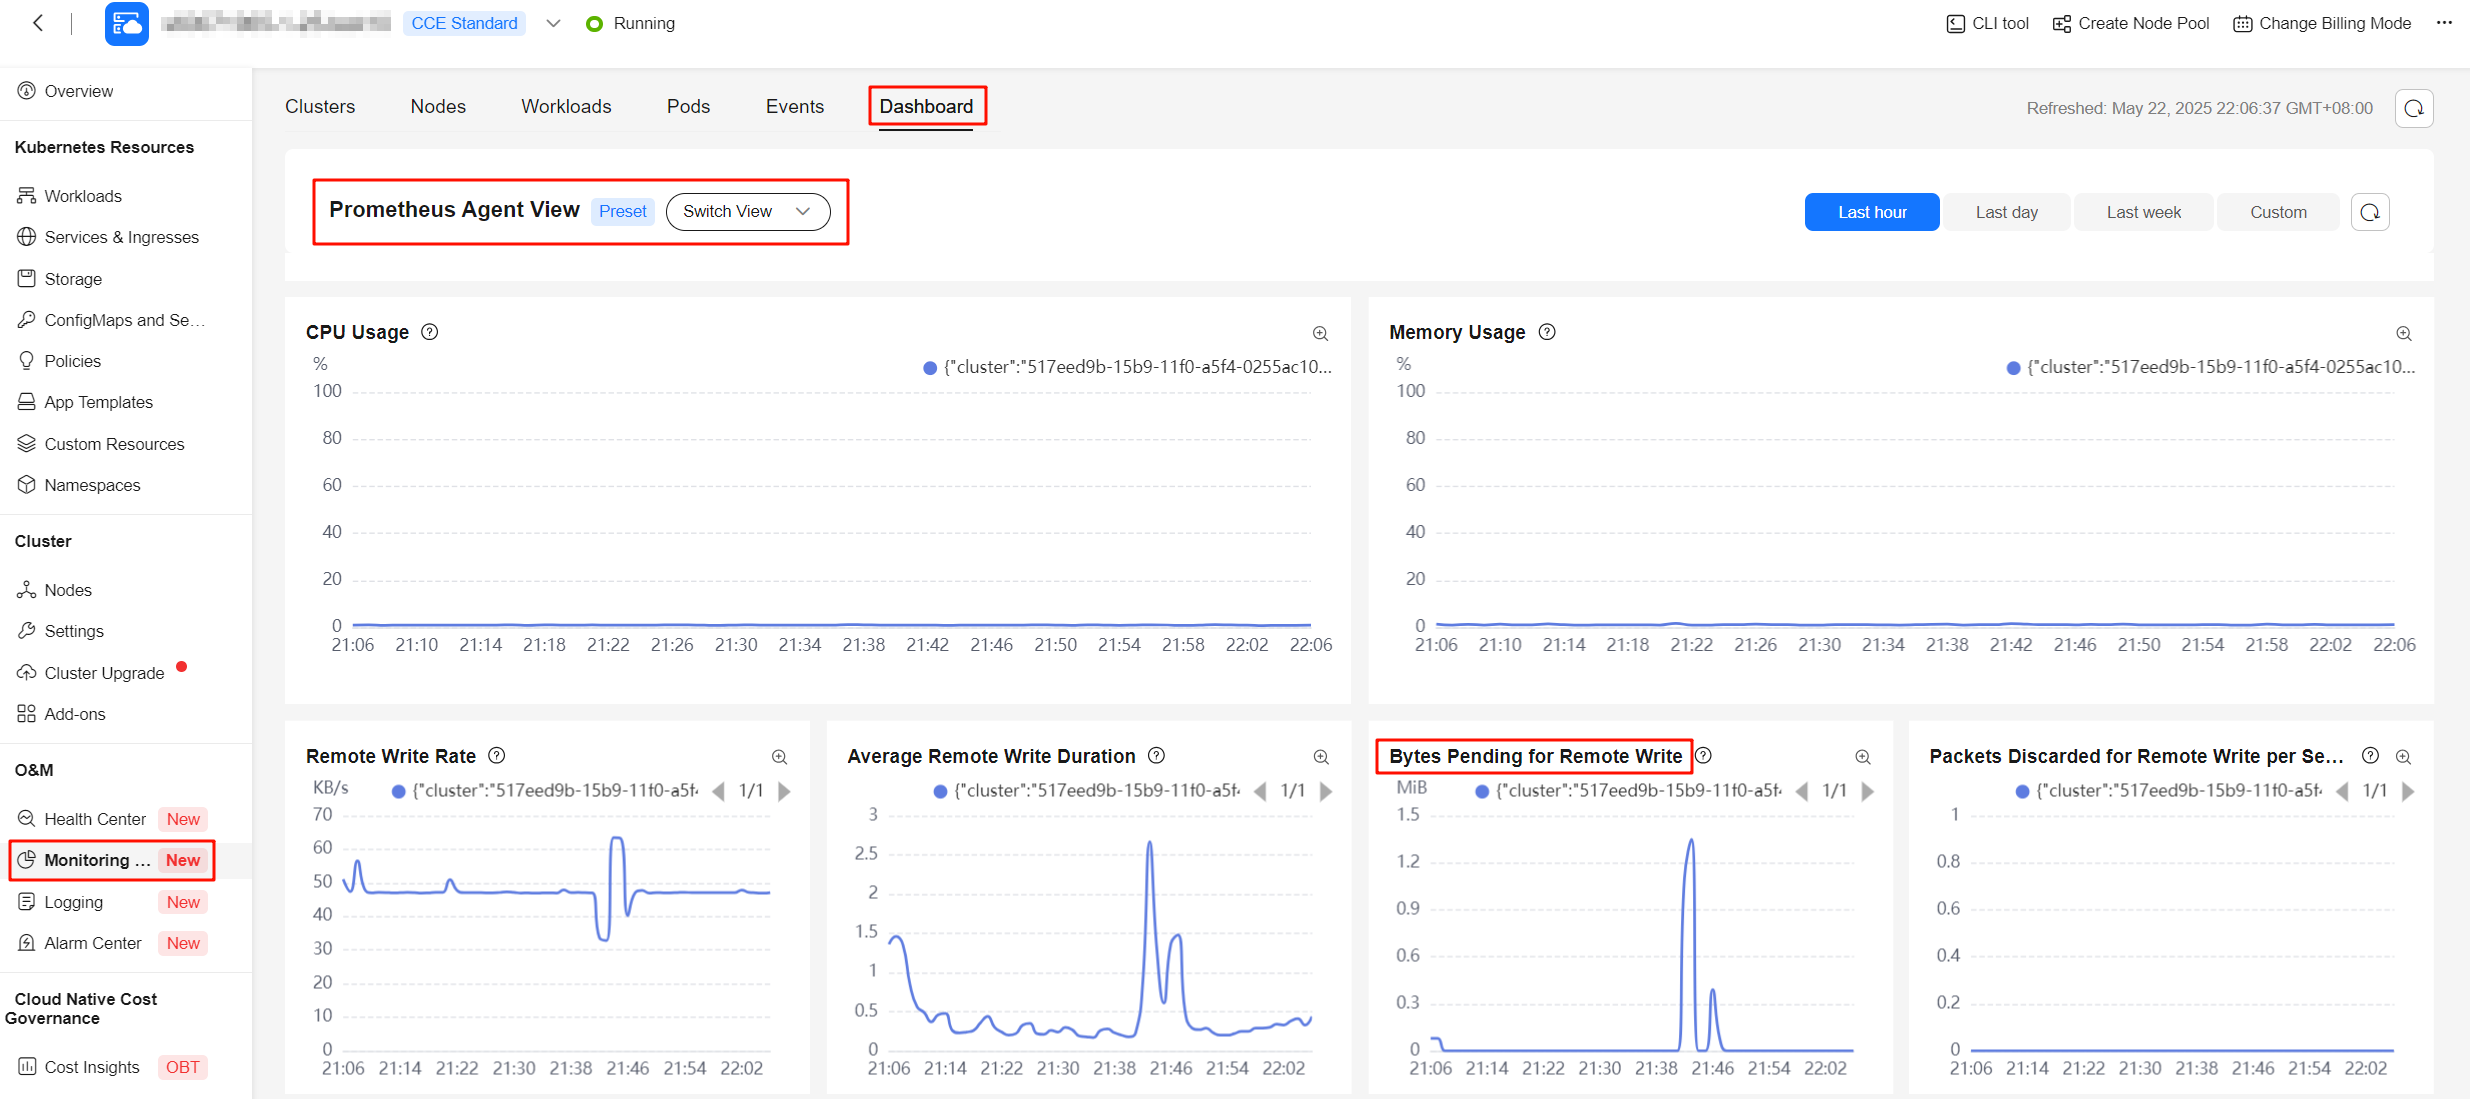
- Go to the Dashboard tab (Monitoring Center > Dashboard), select Prometheus-Agent View, and check Bytes Pending for Remote Write. The value of this metric must be less than 100 MiB for a long time.

prometheus-server OOM

prometheus-server exists only when the local storage is enabled.
prometheus-server stores metrics of the last two hours in the memory for quick query. As the number of metrics increases, the memory usage increases accordingly.
If prometheus-server has an OOM error, it may persist. This is because the full metrics of the last two hours need to be loaded from a write-ahead log (WAL) to the memory each time prometheus-server starts. This process usually consumes more memory than that when prometheus-server runs normally.
On the add-ons page, you can increase the memory limit of prometheus-server by 50% to 100% and then observe prometheus-server. (The prometheus-server startup may take 5 to 30 minutes, depending on the total number of metrics and disk performance.)
thanos-query and thanos-sidecar OOM

thanos-query and thanos-sidecar exist only when the local storage and high availability are enabled. thanos-query deduplicates data from high-availability pairs.
If a large number of long-term queries are executed or there are a large number of concurrent queries, thanos-query and thanos-sidecar may have OOM errors.
On the add-ons page, you can increase the CPU and memory limits for thanos-query and thanos-sidecar by 100%.
kube-state-metrics OOM
kube-state-metrics exposes metrics about Kubernetes cluster objects. The metric scale correlates with the cluster scale.
You are advised to adjust the shards and resources of kube-state-metrics. For details, see Configuring the Cloud Native Cluster Monitoring Add-on in a Large-Scale Cluster.
Feedback
Was this page helpful?
Provide feedbackThank you very much for your feedback. We will continue working to improve the documentation.See the reply and handling status in My Cloud VOC.
For any further questions, feel free to contact us through the chatbot.
Chatbot


