

Unified Metric Monitoring Through a Prometheus Instance for Multi-Account Aggregation
This section describes how to centrally monitor metric data of different accounts.
Scenario
O&M personnel of an e-commerce platform need to monitor metric data of different accounts in real time.
Solution
Create a Prometheus instance for multi-account aggregation and connect accounts, cloud services, and cloud service metrics. On the Metric Browsing page, you can monitor metrics of multiple member accounts and set alarm rules for them. If a metric is abnormal, an alarm will be triggered immediately and a notification will be sent.
| Procedure | Description |
|---|---|
| Step 1: Ingest Cloud Service Metrics Under a Monitored Account | Under the monitored account B, ingest the metrics of one or more cloud services to AOM. |
| The organization administrator sets monitoring account A to be the delegated administrator. If monitoring account A is the organization administrator, skip this step. | |
| Create a multi-account aggregation instance under monitoring account A and add account B's Prometheus instance to which cloud service metrics have been ingested (as described in step 1) for monitoring. | |
| Step 4: Configure an Alarm Rule and Visualization Using the Monitoring Account | Configure alarm rules, alarm notifications, and dashboard display for the cloud service metrics of the multi-account aggregation instance. |
Prerequisites
- The monitoring account and the monitored account have been added to an organization. The monitoring account must be an organization administrator. If not, perform step 2 to set a delegated administrator.
Step 1: Ingest Cloud Service Metrics Under a Monitored Account
- Log in to the AOM 2.0 console as monitored account B.
- In the navigation pane, choose Access Center > Access Center.
- Select the check box next to Cloud services under Types to filter out cloud service cards.
- Click Ingest Metric (AOM) on the FunctionGraph card. The Ingest Cloud Service Metric page is displayed.
- Instance Type: The default value is Common Prometheus instance and cannot be changed.
- Instance Name: Select test111 from the instance drop-down list.
- Click Next to go to the ingestion rule configuration page.
- Click Confirm. Wait for 2 to 3 minutes and view the ingested metric data on the Metric Browsing page. You can view the metric ingestion rule on the Access Center > Access Management page or view metrics on the Metric Browsing page.


Step 2: Enable Access for AOM and Set a Delegated Administrator (Skip this Step You Are an Organization Administrator)
- Log in to the Organizations console as an administrator.
- In the navigation pane, choose Services.
- In the service list, locate Application Operations Management (AOM) and click Enable Access in the Operation column.
- Click Specify Delegated Administrator in the Operation column of AOM, select the desired account, and click OK. As shown in Figure 1, paas_aom is specified as the delegated administrator.

Step 3: Create an Instance for Multi-Account Aggregation
- Log in to the AOM 2.0 console as an administrator or delegated administrator.
- In the navigation pane, choose Prometheus Monitoring > Instances. On the displayed page, click Add Prometheus Instance.
- On the displayed page, set parameters by referring to Table 3.
Table 3 Parameters for creating a Prometheus instance Parameter
Description
Example
Instance Name
Name of a Prometheus instance.
Enter a maximum of 100 characters and do not start or end with an underscore (_) or hyphen (-). Only letters, digits, underscores, and hyphens are allowed.
test-aom
Enterprise Project
Enterprise project to which the instance belongs. Select a project from the drop-down list. If the existing enterprise projects cannot meet your requirements, create one by referring to Creating an Enterprise Project.
default
Instance Type
Type of the Prometheus instance. Select Prometheus for multi-account aggregation.
Prometheus for multi-account aggregation
Tag
Click Add and enter a tag key and value to add a tag.
- Max.: 20 tags.
- A tag key can contain letters, digits, spaces, and special characters (_.:=+-@), but cannot start or end with a space or start with _sys_.
- A tag value can contain letters, digits, spaces, and special characters (_.:/=+-@).
-
Description
Description of the Prometheus instance. Enter up to 1,024 characters.
Example of a Prometheus instance for multi-account aggregation
Aggregation Mode
Mode for aggregating Prometheus instances.
- Current account's Prometheus instances: Aggregates the Prometheus instances of the current account to the multi-account aggregation instance.
- Other accounts' Prometheus instances: Aggregates the Prometheus instances of other accounts in the same organization to the multi-account aggregation instance.
Other accounts' Prometheus instances
Select Accounts to Aggregate
In the account tree, select the accounts to aggregate.
paas_apm
Select Instances to Aggregate
Click an account name in the account tree on the left and select the instances to aggregate from the Prometheus instance list.
test111
- Click OK. As shown in Figure 2, a multi-account aggregation instance named test-aom is created.

Step 4: Configure an Alarm Rule and Visualization Using the Monitoring Account
- Check whether the metrics of the created instance are ingested.
- In the navigation pane, choose Metric Browsing. In the Prometheus Instance drop-down list, select instance test-aom created in step 3.
- Click Interaction, select a metric, and copy the metric name. In this example, select aom_node_cpu_usage.
- Click PromQL and enter sum(metric name) by (aom_source_account_name) to check whether the metric is ingested. For example, enter sum(aom_node_cpu_usage) by (aom_source_account_name). Figure 3 Checking the metric

- Click Interaction and select the metric to be monitored. As shown in Figure 4, select the aom_node_cpu_usage metric so that its values and trends under the paas_apm and paas_aom accounts can be monitored in real time.
- Click Add Alarm Rule in the upper right corner of the metric list to add an alarm rule for the selected metric.
- Set basic information about the alarm rule by referring to Table 4.
Table 4 Basic information Parameter
Description
Example Value
Original Rule Name
Original name of the alarm rule. Enter a maximum of 256 characters and do not start or end with any special character. Only letters, digits, underscores (_), and hyphens (-) are allowed.
monitor
Rule Name
Name of the alarm rule. Max.: 256 characters. Only letters, digits, hyphens (-), and underscores (_) are allowed. Do not start or end with a hyphen or underscore. In this example, leave this parameter blank.
-
Enterprise Project
Select the required enterprise project. The default value is default.
default
Description
Description of the rule. Enter up to 1,024 characters. In this example, leave this parameter blank.
-
- Set the detailed information about the alarm rule.
- By default, the rule type, configuration mode, and Prometheus instance in the alarm rule settings are the same as those on the Metric Browsing page.
- Set alarm rule details. By default, the metric selected on the Metric Browsing page is automatically displayed.
You need to set information such as the statistical period, condition, detection rule, trigger condition, and alarm severity. The detection rule consists of the statistical mode (Avg, Min, Max, Sum, and Samples), determination criterion (≥, ≤, >, and <), and threshold value. For example, if Statistical Period is 1 minute, Rule is Avg >1, Consecutive Periods is 3, and Alarm Severity is Critical, a critical alarm will be generated when the average metric value is greater than 1 for three consecutive periods.
Figure 5 Setting an alarm rule

- Click Advanced Settings and set information such as Check Interval and Alarm Clearance. For details about the parameters, see Table 5.
Table 5 Advanced settings Parameter
Description
Example Value
Check Interval
Interval at which metric query and analysis results are checked.
Custom interval: 1 minute
Alarm Clearance
The alarm will be cleared when the alarm condition is not met for a specified number of consecutive periods.
1
Action Taken for Insufficient Data
Action to be taken if there is no or insufficient metric data within the monitoring period. Enable this option if needed.
Enabled: If the data is insufficient for 1 period, the status will change to Insufficient data and an alarm will be sent.
Tags
Click
 to add tags for alarm rules. They will be synchronized to TMS. They can be used to filter alarm rules and group alarms to reduce noise. They can also be referenced as "${event.metadata.tag key}" in message templates.
Alarm tags are attributes that can be used to identify alarms. They are in the format of "key:value". In this example, leave this parameter blank.
-
Annotations
Click
 to add attributes (key-value pairs) for alarm rules. Annotations will not be synchronized to TMS, but can be used to group alarms to reduce noise and referenced as "${event.metadata.annotation key}" in message templates.
Alarm annotations are attributes that cannot be used to identify alarms. They are in the format of "key:value". In this example, leave this parameter blank.
-
- Set an alarm notification policy. For details, see Table 6. Figure 6 Alarm notification
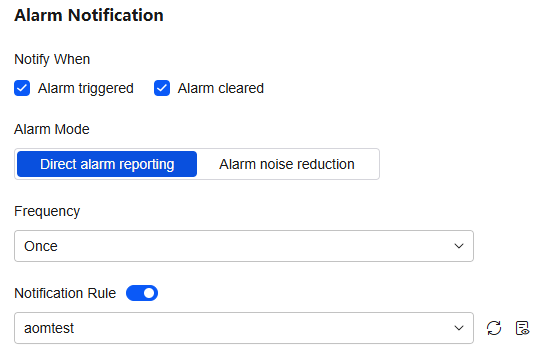
Table 6 Alarm notification policy parameters Parameter
Description
Example Value
Notify When
Set the scenario for sending alarm notifications. By default, Alarm triggered and Alarm cleared are selected.
- Alarm triggered: If the alarm trigger condition is met, the system sends an alarm notification to the specified personnel by email or SMS.
- Alarm cleared: If the alarm clearance condition is met, the system sends an alarm notification to the specified personnel by email or SMS.
Retain the default value.
Alarm Mode
- Direct alarm reporting: An alarm is directly sent when the alarm condition is met. If you select this mode, set an interval for notification and specify whether to enable a notification rule.
- Frequency: interval for sending alarm notifications. Select a desired value from the drop-down list.
- Notification Rule: After the rule is enabled, the system sends notifications based on the associated SMN topic and message template. If there is no notification rule you want to select, click Add Rule in the drop-down list to create one. For details, see Creating an Alarm Notification Rule.
Alarm Mode: Select Direct alarm reporting.
Frequency: Select Once.
Notification Rule: aomtest
- Click Confirm. Then click View Rule to view the created rule.
Click a rule name to view details. If a monitored object meets the configured alarm condition, a metric alarm is generated on the alarm list page. To view the alarm, choose Alarm Center > Alarm List in the navigation pane. If a host meets the preset notification policy, the system sends an alarm notification to the specified personnel by email, SMS, or WeCom.
- Set basic information about the alarm rule by referring to Table 4.
- Click Add to Dashboard in the upper right corner of the metric list to add the graph to the dashboard. Figure 7 Adding the graph to a dashboard

- Enter the graph name aom_cpu and select Existing for Target Dashboard. If the dashboards in the list cannot meet your requirements, click Create Dashboard to create one. For details, see Creating a Dashboard.
- Click Confirm. The dashboard page is displayed. As shown in Figure 8, the CPU Usage graph is added to the aom dashboard so that its values and trends under the paas_apm and paas_aom accounts can be monitored in real time.


What is your overall rating for this page?
Thank you very much for your feedback. We will continue working to improve the documentation.See the reply and handling status in My Cloud VOC.
For any further questions, feel free to contact us through the chatbot.
Chatbot


