
Viewing Instance Overview Data
The Overview page gives you an overview of your DB instances, including instances by status, alarms, and key performance metrics. It also displays detected exceptions and provides handling suggestions with RDS intelligent diagnosis.
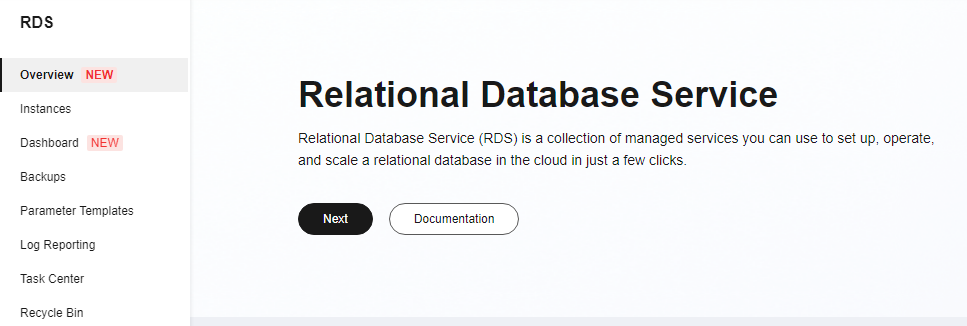
Learning About RDS
If you are new to RDS, you can quickly learn about RDS concepts, common functions, APIs, and how to buy and get started with a DB instance by referring to RDS Progressive Knowledge.
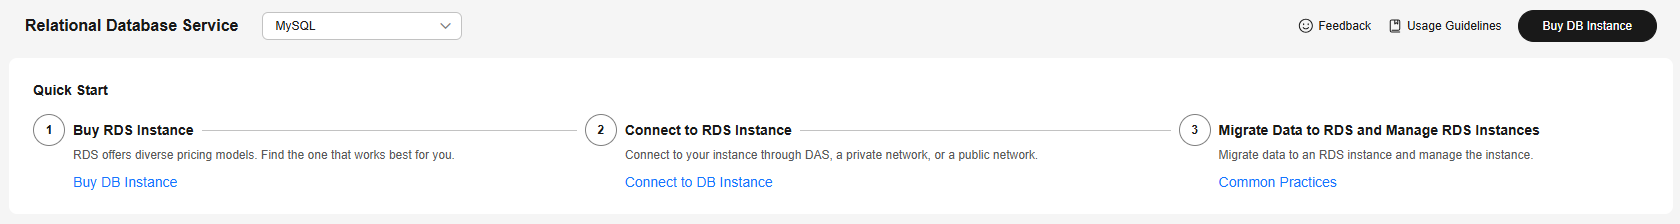
- To purchase an RDS for MySQL instance, click Buy on the Overview page and select your desired version and specifications. For details, see Buying an RDS for MySQL DB Instance.
- After the purchase is complete, you can view instances by status, alarms, and intelligent diagnosis statistics on the Overview page.
Functions
The statuses of all RDS for MySQL instances under your account are displayed after you select MySQL next to Relational Database Service in the upper part of the Overview page.
|
Item |
Description |
Operation |
Solution |
|---|---|---|---|
|
Total instances |
Total number of DB instances and read replicas in all statuses. |
Click Total instances to go to the instance list and view all instances. |
- |
|
Abnormal |
Total number of instances in the Abnormal status. |
Click Abnormal to go to the instance list and view abnormal instances. |
|
|
Out of storage |
Total number of instances in the Storage full status. |
Click Out of storage to go to the instance list and view instances that are out of storage. |
For details, see Full Storage of RDS for MySQL Instances. |
|
Frozen |
Total number of instances in the Frozen status. |
Click Frozen to go to the instance list and view frozen instances. |
For details, see Resource Freezing, Release, Stopping, Deletion, and Unsubscription. |
|
Pending reboot |
Total number of instances in the Parameter change. Pending reboot status.
NOTE:
Modifications to some parameters require an instance reboot before they can be applied. |
Click Pending reboot to go to the instance list and view instances waiting to be rebooted. |
Reboot the instances. |
|
Newly purchased |
Total number of RDS for MySQL instances purchased in the last seven days. |
Click Newly purchased to go to the instance list and view instances purchased in the last seven days. |
- |
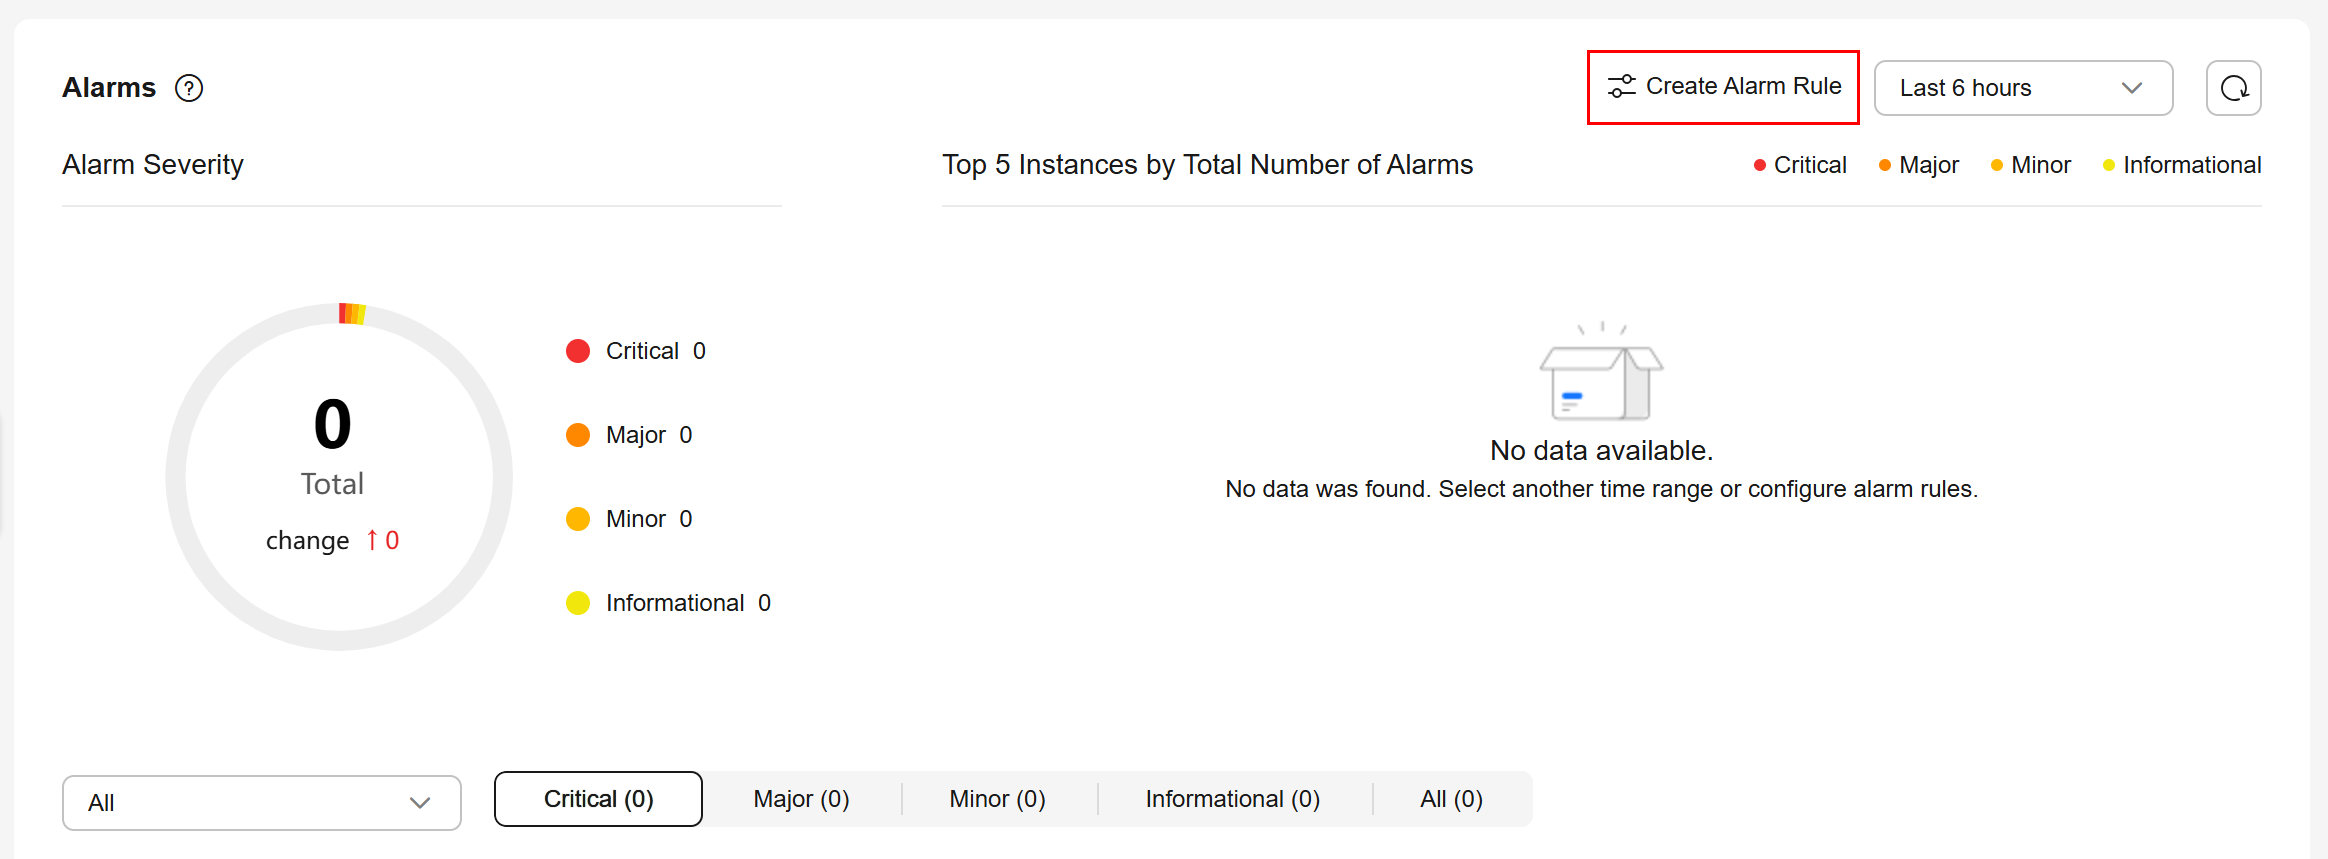
Based on the configuration of alarm rules, you can see active alarms of all RDS for MySQL instances under your current account, including alarms in the Alarm (metric) and Triggered (event) states.
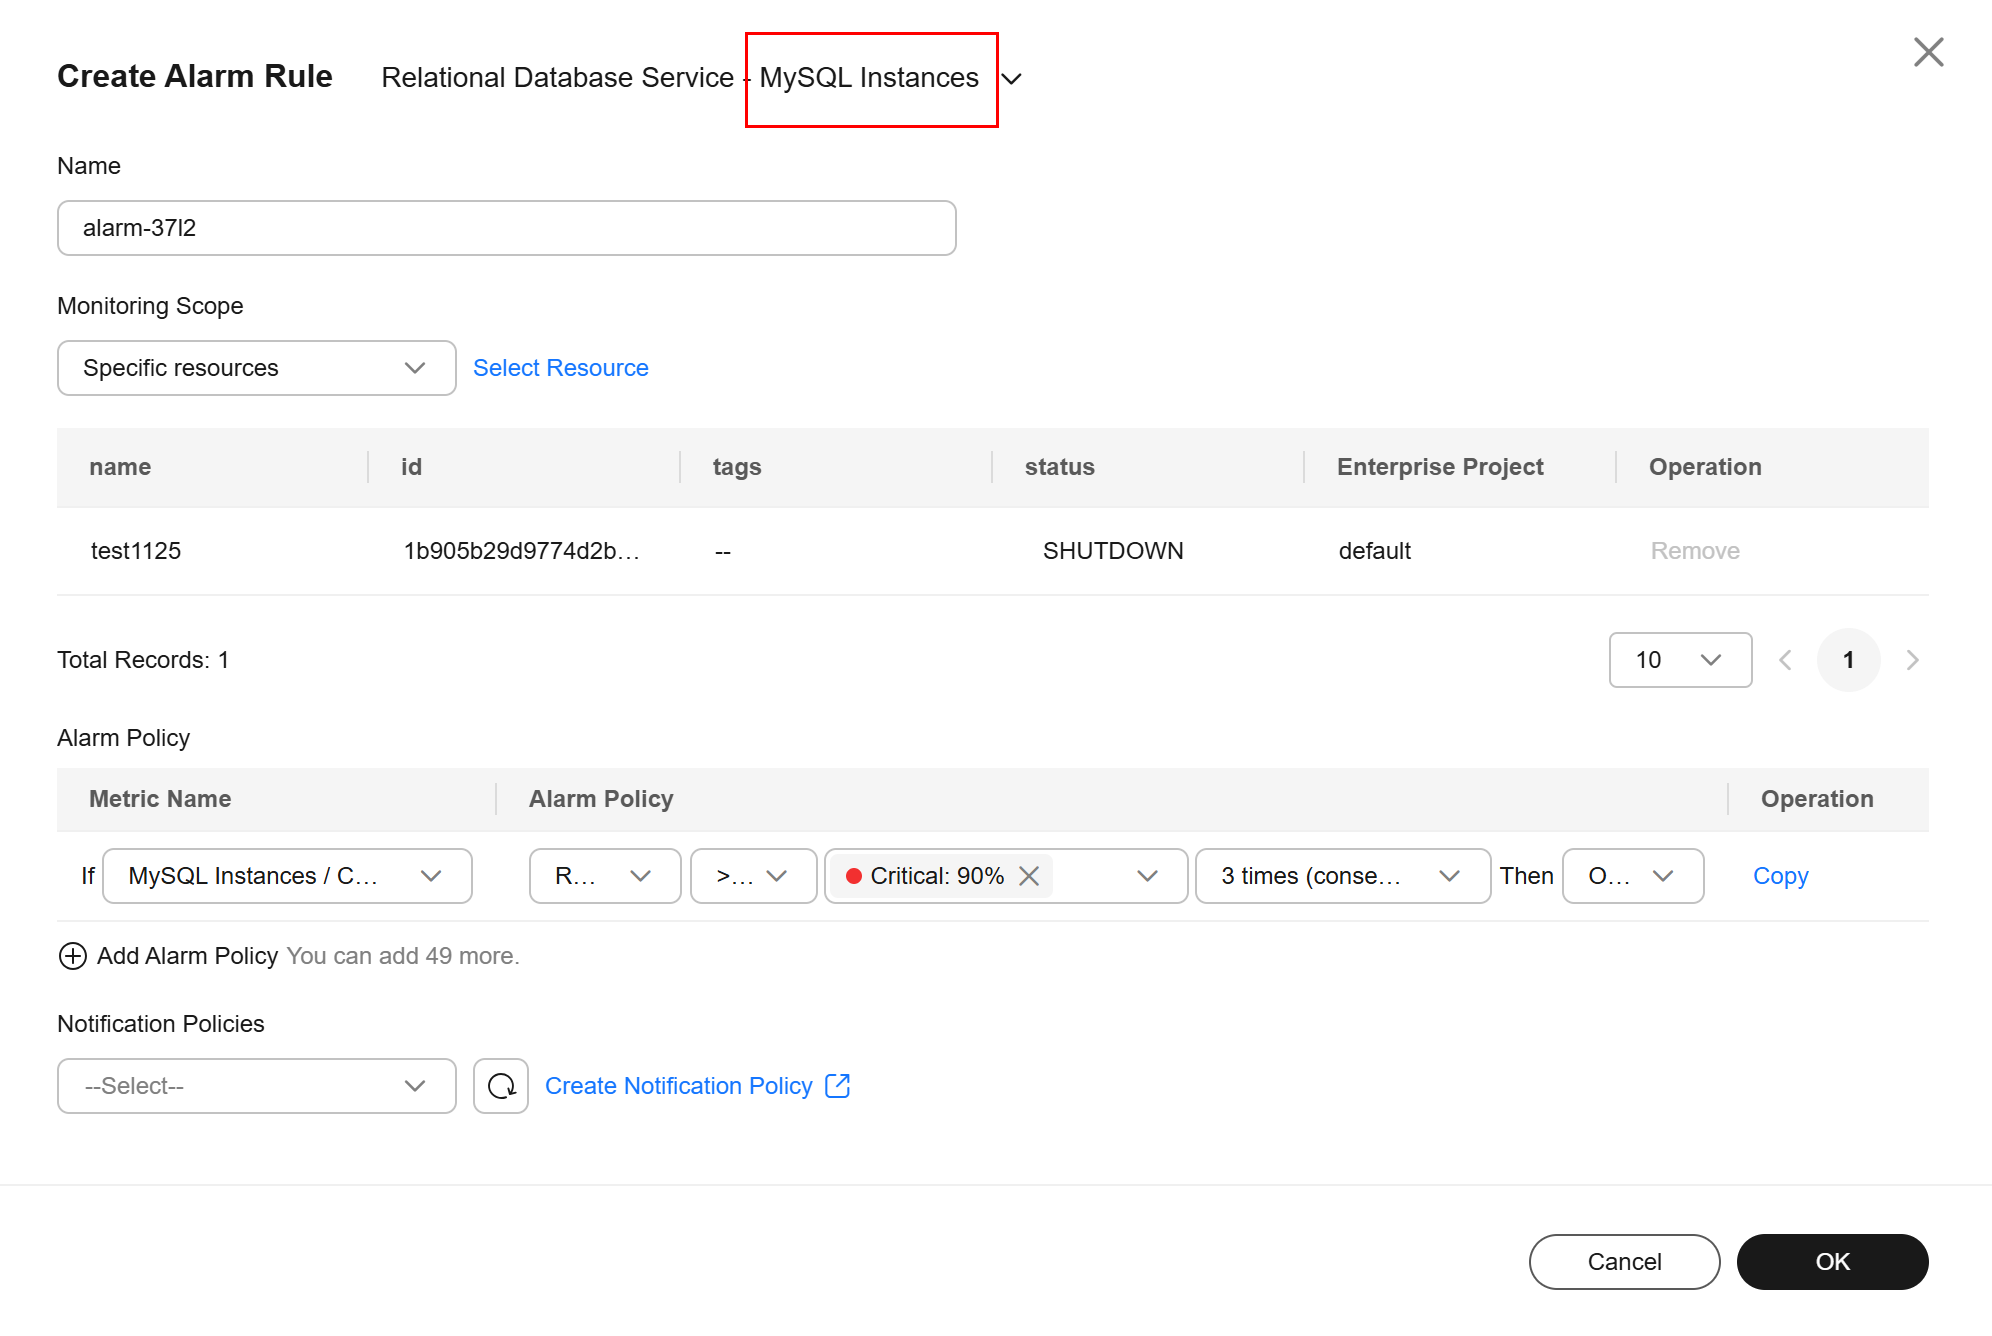
- In the Alarms area, click Create Alarm Rule.
Figure 3 Create Alarm Rule
- In the dialog box displayed on the right, toggle on the Enable All Recommended Alarm Rules switch. Once this function is enabled, it applies to all resources in the current region.
Figure 4 Enable All Recommended Alarm Rules
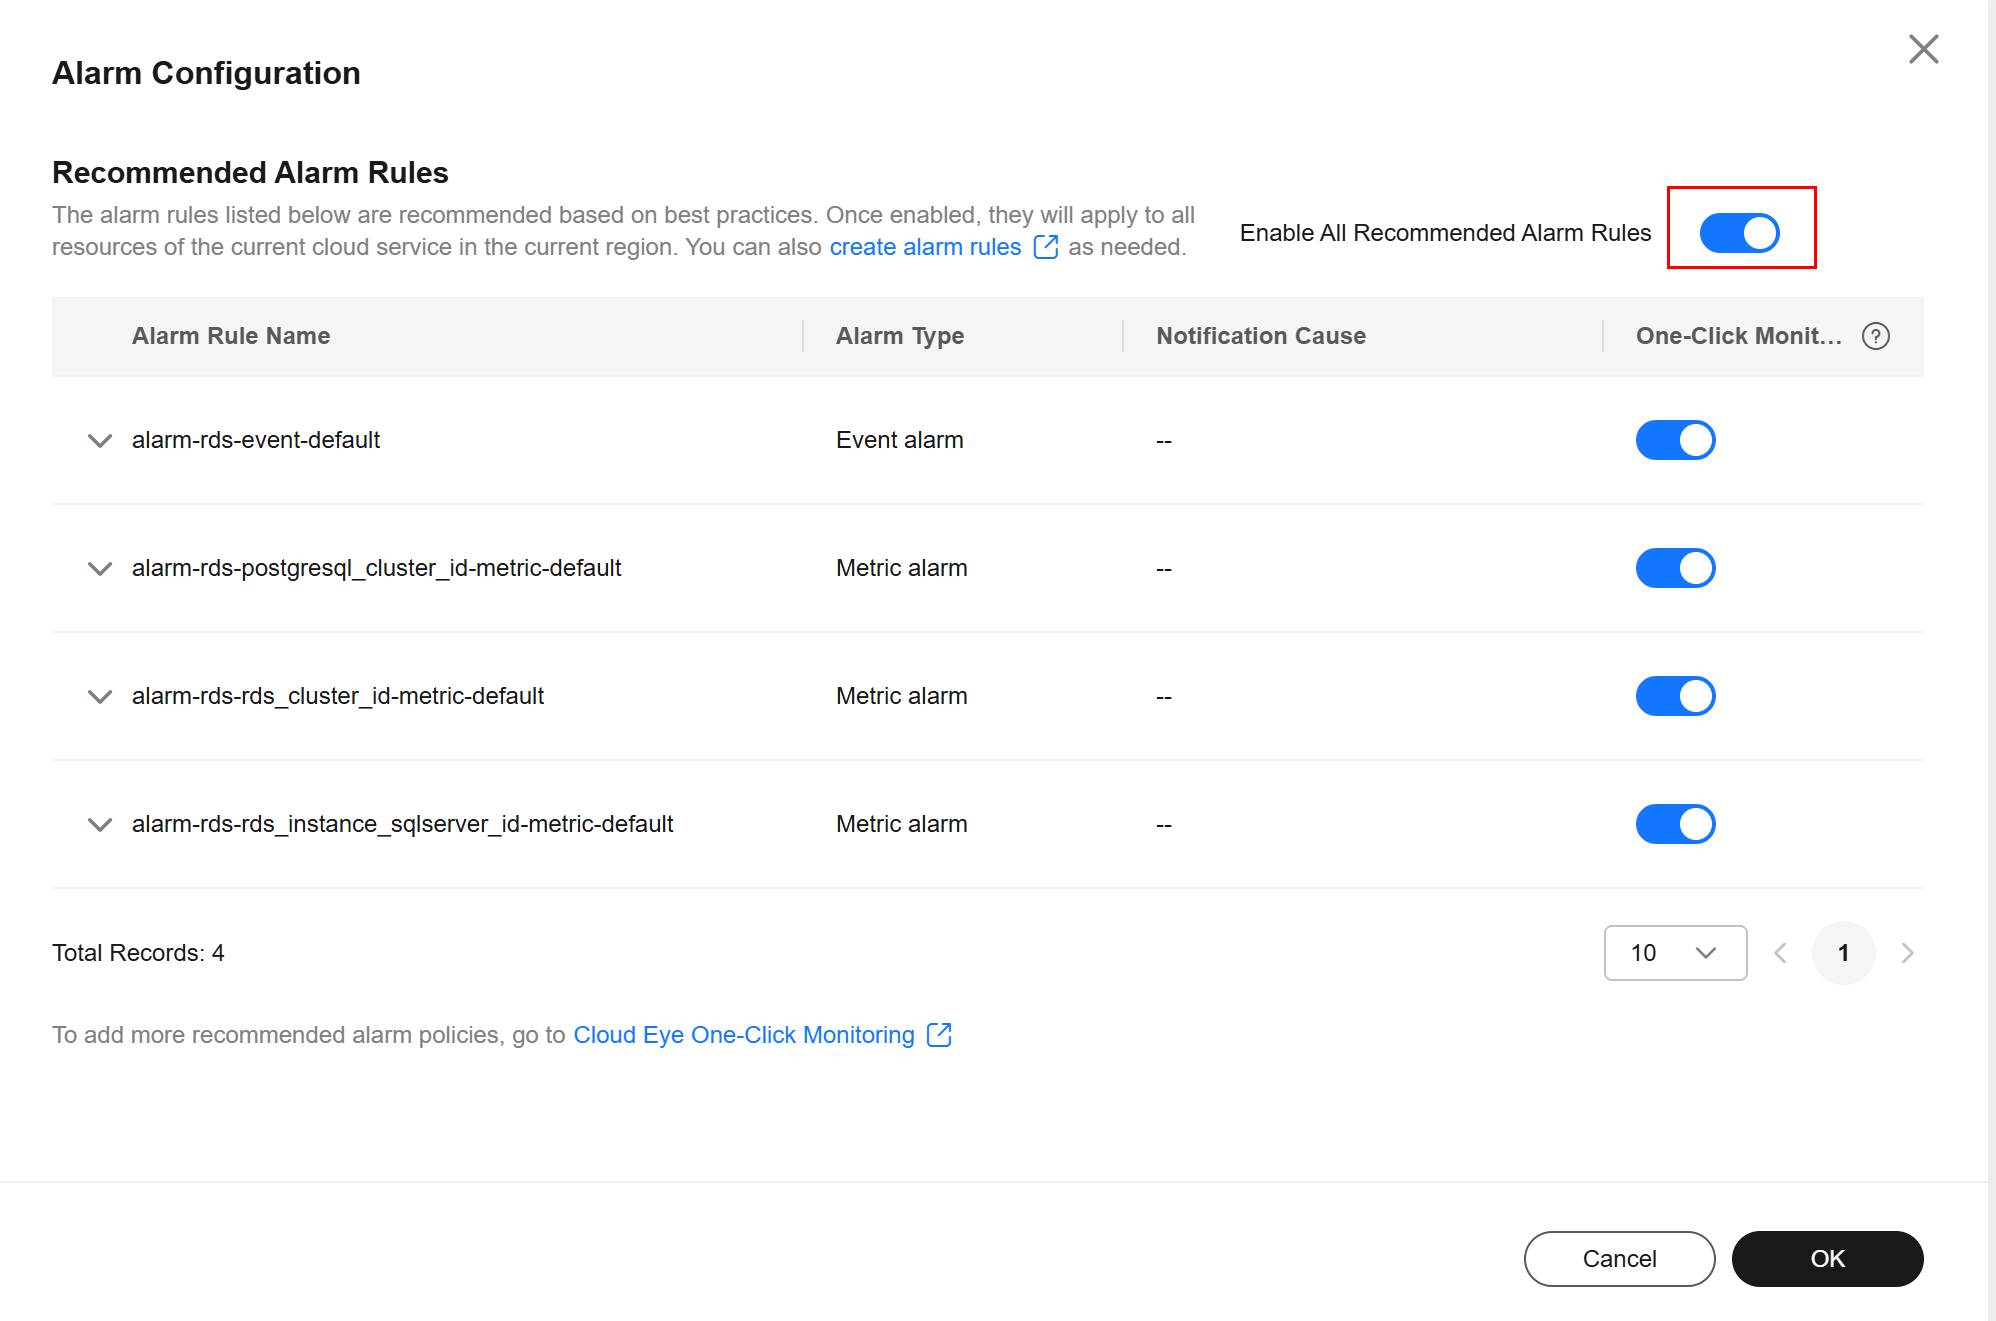
After the function is enabled, you can modify alarm policies and disable alarm rules.
- If the recommended alarm rules do not meet your requirements, you can create custom ones. Click create alarm rules to create alarm rules to monitor metrics or events for your DB instance. For details, see Setting Alarm Rules.
Figure 5 Creating an alarm rule
- To view alarm details, select a time window in the upper part of the Alarms area.
The time window can be Last 1 hour, Last 6 hours, Last 12 hours, Last day, Last week, or Last month.
Figure 6 Alarms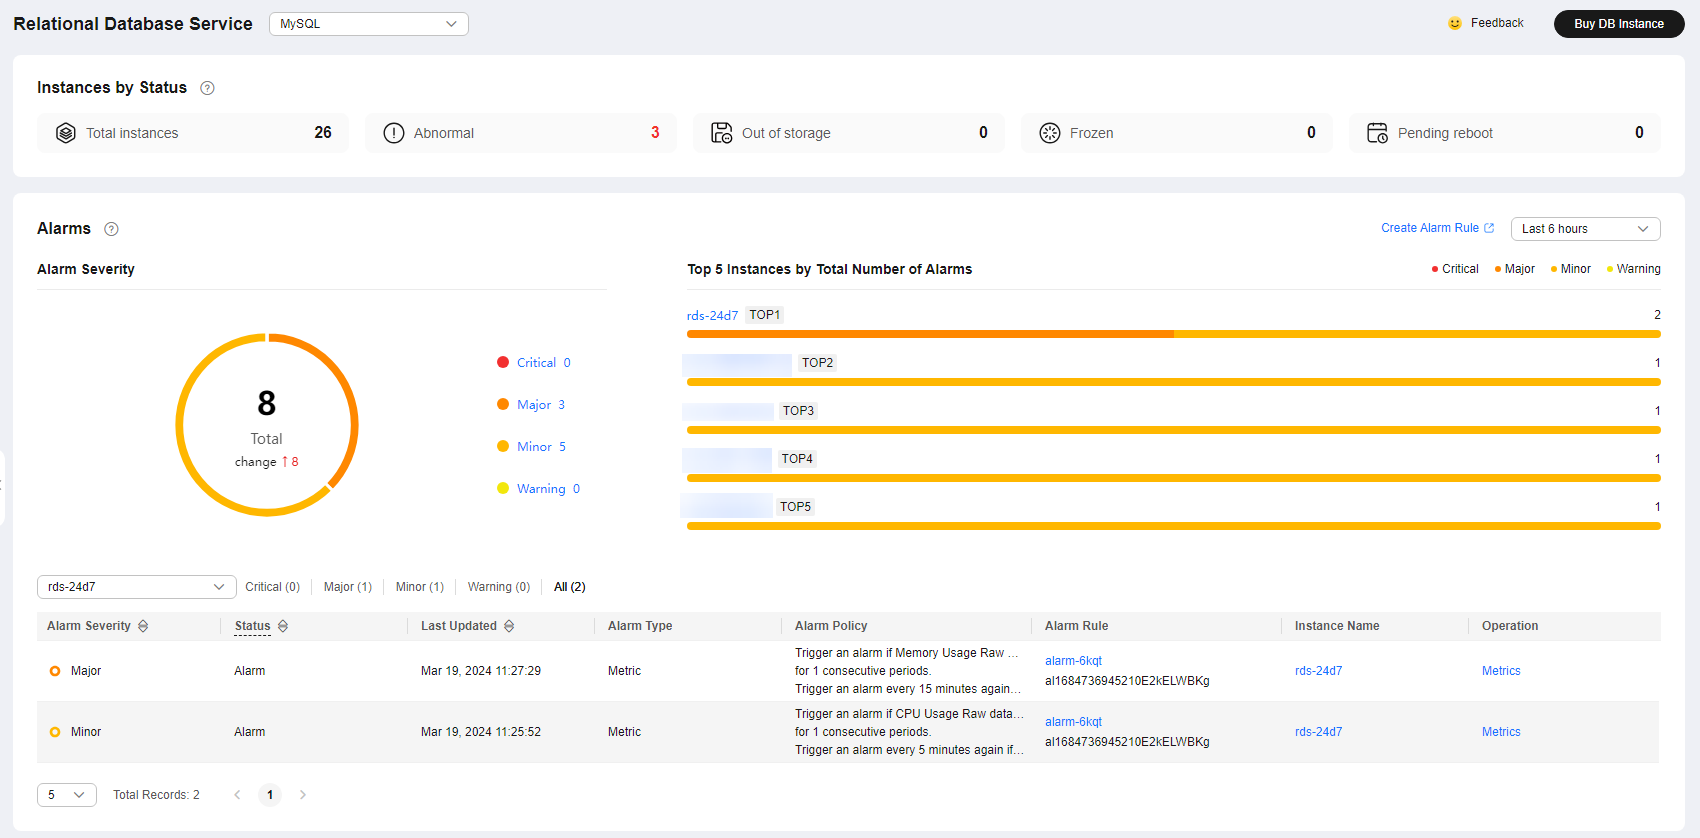
Instance alarm details are displayed from multiple dimensions. For details, see Table 2 and Table 3.
|
Item |
Description |
|---|---|
|
Alarm Severity |
Displays the number of alarms at each severity. The alarm severity can be critical, major, minor, or warning. |
|
Top 5 Instances by Total Number of Alarms |
Displays alarm statistics of the top 5 instances with the largest number of alarms. Hover over an instance to see the number of its alarms of each severity. You can view alarm details of a specific instance and alarm severity. |
|
Item |
Description |
|---|---|
|
Alarm Severity |
There are four severities: critical, major, minor, and warning. Above the alarm list, you can choose to view alarms of a specific severity or all severities. |
|
Status |
|
|
Last Updated |
The latest time when the alarm was triggered. |
|
Alarm Type |
The alarm type that the alarm rule applies to.
|
|
Alarm Policy |
The policy for triggering an alarm.
|
|
Alarm Rule |
The name or ID of the alarm rule. |
|
Instance Name |
The name of the instance that triggers the alarm. You can select All or a specific instance from the drop-down list to view the alarm details. Refresh the page to display details of the latest triggered alarms in real time. |
|
Operation |
Click Metrics. In the dialog box displayed on the right, you can see the metric changes in the selected time window. |
Intelligent Diagnosis checks instance health using instance operation data and intelligent algorithms and provides diagnosis results and suggestions.
- To view problematic instances and related metrics, click the name of a diagnosis item.
- To view detailed diagnosis results and optimization suggestions, click Diagnosis Details.
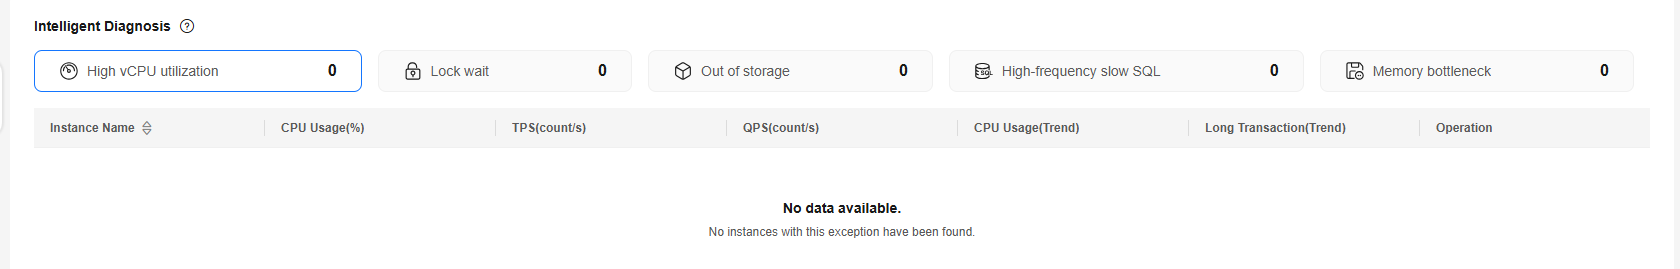
Table 4 provides the supported diagnosis items and handling suggestions.
|
Diagnosis Item |
Metric |
Metric Description |
Solution |
Practices |
|---|---|---|---|---|
|
High vCPU utilization |
CPU Usage(%) |
CPU usage of the monitored object |
|
|
|
TPS(Times/s) |
Execution times of submitted and rollback transactions per second |
|||
|
QPS(Times/s) |
Query times of SQL statements (including stored procedures) per second |
|||
|
CPU Usage(Trend) |
CPU usage of the monitored object |
|||
|
Long Transaction(Trend) |
Maximum duration for starting a transaction A complete long transaction is counted only when the BEGIN and COMMIT commands exist before and after the related operation commands, respectively. |
|||
|
Lock wait |
Row Locks Waits Transactions(Counts) |
Number of InnoDB row lock waits This metric indicates the total number of historical transactions waiting for row locks. Lock waits will be cleared after the instance is rebooted. |
For details, see Managing Locks & Transactions. |
|
|
Average Row Lock Wait Time(ms) |
Average wait time of historical InnoDB row locks |
|||
|
Current Row Lock Waits(Counts) |
Number of current InnoDB row lock waits This metric indicates the number of transactions that are currently waiting for row locks. |
|||
|
MDL Locks(Counts) |
Number of metadata locks |
|||
|
Long Transaction(Trend) |
Maximum duration for starting a transaction A complete long transaction is counted only when the BEGIN and COMMIT commands exist before and after the related operation commands, respectively. |
|||
|
Out of storage |
Storage Space Usage(%) |
Storage space usage of the monitored object |
|
|
|
Used Storage Space(GB) |
Used storage space of the monitored object |
|||
|
Total Storage Space(GB) |
Total storage space of the monitored object |
|||
|
Storage Space Usage(Trend) |
Storage space usage of the monitored object |
|||
|
High-frequency slow SQL |
Slow Query Logs(Count/min) |
Number of MySQL slow query logs generated per minute |
|
Slow SQL Statements Due to Improper Composite Index Settings |
|
Slow Query Logs(Trend) |
Number of MySQL slow query logs generated per minute |
|||
|
Memory bottleneck |
Memory Usage(%) |
Memory usage of the monitored object |
|
|
|
Total Connections(Count) |
Total number of connections that attempt to connect to the MySQL server |
|||
|
Current Active Connections(Count) |
Number of connections that are not in the sleep state |
|||
|
Memory Usage(Trend) |
Memory usage of the monitored object |
Feedback
Was this page helpful?
Provide feedbackThank you very much for your feedback. We will continue working to improve the documentation.See the reply and handling status in My Cloud VOC.
For any further questions, feel free to contact us through the chatbot.
Chatbot


