
Managing Function Flows
After a function flow is created, you can check its configuration, execution history, and execution logs, retry a failed flow, or terminate an ongoing flow.
Viewing Flows
- Log in to the FunctionGraph console. In the navigation pane, choose Flows.
- View flows in card or list mode. Figure 1 Selecting a display mode

- Card mode Figure 2 Card mode

- List mode Figure 3 List mode

- Card mode
- View all flows that you have created, and perform the operations described in Table 1 as required.
Table 1 Operation description Operation
Description
Edit
Click Edit to modify a flow.
Start
Choose More > Start to execute a flow.
Delete
- Deleting a single flow: Choose More > Delete to delete a flow.
- Deleting multiple flows: Select multiple flows and click Delete in the upper left corner to delete them.
- Click the name of a flow to view details.
- Viewing basic information
On the Basic Information tab page, view the flow name, ID, update time, and creation time.
- Viewing task running records (only for standard function flows)
On the Metric tab page, view the execution history, input, output, and node logs.
To modify the flow information, click Design in the upper right corner.
- Viewing task logs (only for express function flows)
On the Logs tab page, click the request ID to view the execution result logs. You can download a maximum of 5,000 logs at a time.
- View flow metrics
On the Monitoring tab page, view the counts of invocations, errors, running flows, and throttles, and the running duration. Table 2 describes the monitoring metrics.
Table 2 Flow metrics Metric
Unit
Description
Invocations
Count
Total number of invocation requests, including successful, failed, and number of executions that are in progress. In case of asynchronous invocation, the count starts only when a flow executes in response to a request.
Duration
ms
Average time taken to execute a flow in a specified period.
Errors
Count
Number of times that a flow failed to be executed.
Running Workflows
Count
Number of invocation requests that are being processed.
Throttles
Count
Number of times that a flow failed to be executed due to rate limiting.
- Viewing basic information
Viewing the Execution History of a Standard Flow
- On the function flow list page, click the name of a standard flow and click the Executions tab.
- The left pane lists the execution history, showing the latest 100 records. Figure 4 Execution logs
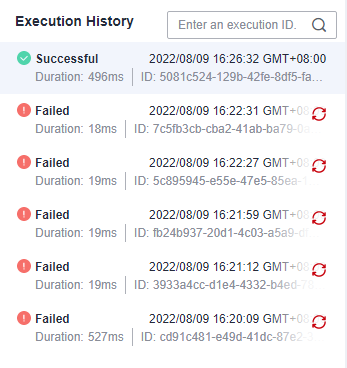
- Click an execution. The execution result is displayed on the canvas in the middle. Nodes in green are successful, and nodes in red have failed.
- Below the canvas is the input and output values of this flow. Click a node on the canvas to check the values. (Output fields with value null will not be displayed.) Figure 5 Input and output display area

- Click
 on the right of a failed execution. If the retry is successful, a new record is generated.
 - Click
 on the right of an ongoing execution, it goes into the canceled state after the execution is stopped.
 - The Node Logs area displays the execution records of all nodes from the start to the end of the flow. Figure 6 Node logs

Viewing Execution Logs of an Express Flow
- On the function flow list page, click the name of an express flow and click the Logs tab.
- Click the request ID to check the execution log details. You can filter logs from the last hour, day, three days, or a custom time range.
Feedback
Was this page helpful?
Provide feedbackThank you very much for your feedback. We will continue working to improve the documentation.See the reply and handling status in My Cloud VOC.
For any further questions, feel free to contact us through the chatbot.
Chatbot


