
Querying and Analyzing Logs
Scenario
You can query and analyze collected log data in real time on the Analyze & Query tab.
This topic walks you through how to query and analyze log data.
Prerequisites
Data access has been completed. For details, see Data Integration.
Executing a Query and Analysis Based on Query Criteria
- Log in to the management console.
- Click
 in the upper part of the page and choose Security > SecMaster.
 - In the navigation pane on the left, choose Workspaces > Management. In the workspace list, click the name of the target workspace.
Figure 1 Workspace management page

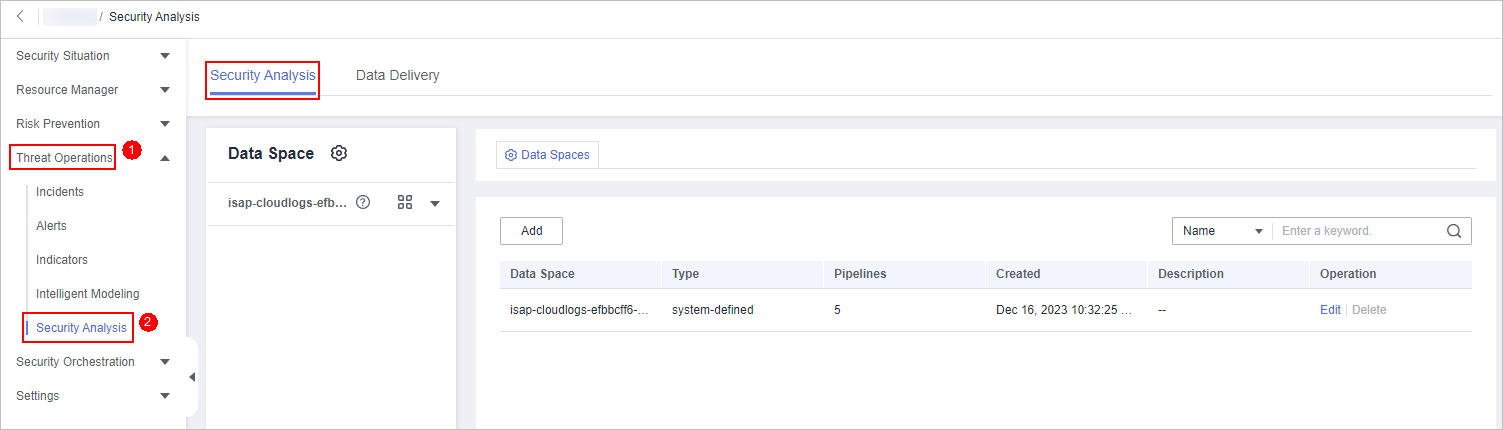
- In the navigation pane on the left, choose . The security analysis page is displayed.
Figure 2 Accessing the Security Analysis tab page
- In the data space navigation tree on the left, click a data space name to show the pipeline list. Click a pipeline name. On the displayed page, you can search the pipeline data.
Figure 3 Pipeline data page
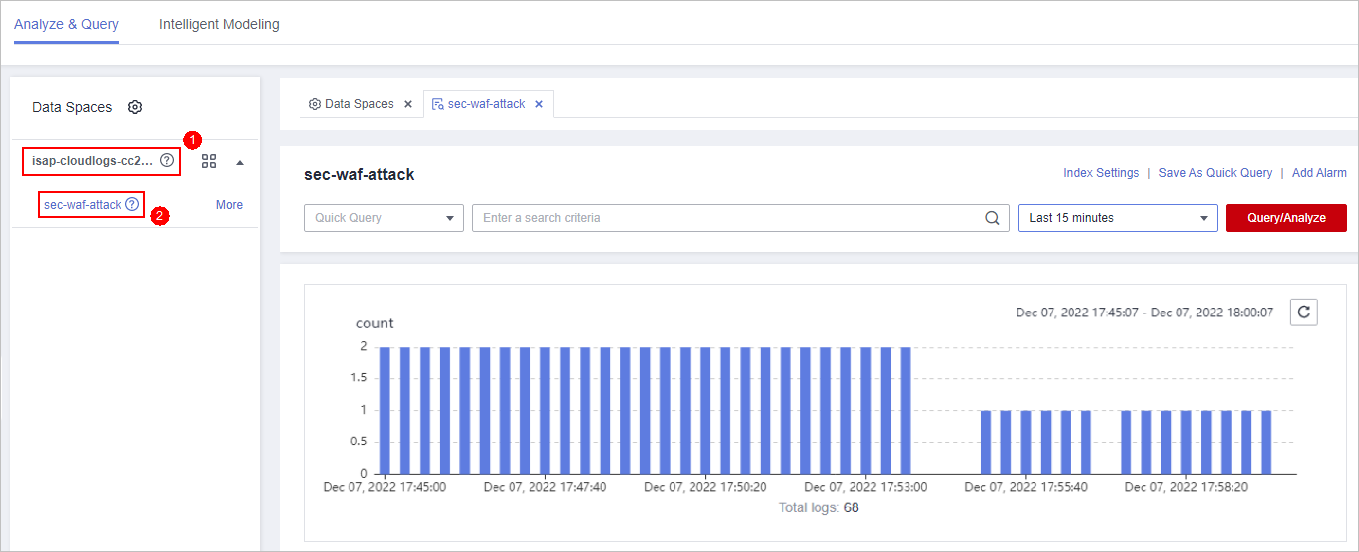
- On the pipeline data retrieval page, enter the query analysis statement.
A query analysis statement consists of a query statement and an analysis statement. The format is Query Statement|Analysis Statement. For details about the syntax of query analysis statements, see Query and Analysis Syntax Overview.

If the reserved field is of the text type, MATCH_QUERY is used for word segmentation query by default.
Figure 4 Query/Analyze
- Select Last 15 minutes as the time range.
You can select Last 15 minutes, Last hour, or Last 24 hours or customize a time range for the query.
- Click Query/Analyze and view the results.
Using Existing Fields for Query and Analysis
The following part describes how to use existing fields to query and analyze logs.
- Log in to the management console.
- Click in the upper part of the page and choose Security > SecMaster.
- In the navigation pane on the left, choose Workspaces > Management. In the workspace list, click the name of the target workspace.
Figure 5 Workspace management page
- In the navigation pane on the left, choose . The security analysis page is displayed.
Figure 6 Accessing the Security Analysis tab page
- In the Data Spaces tree on the left, click a data space name to show the pipeline list. Then, click a pipeline name. On the displayed page, you can search the pipeline data.
Figure 7 Pipeline data page
- Set search criteria.
If the reserved field is of the text type, MATCH_QUERY is used for word segmentation query by default.
- In raw logs, click
 before an optional field on the left and click
  (adding a field value) next to the field to search for specific logs that contain the selected field value. To exclude a field value, click
  before the field name.
 - If you have expanded the log data at a specific time point and need to filter some fields, click
 (adding a field value) in front of the field name. The query box displays the matched fields. To exclude a field value, click
  before the field name.
- In raw logs, click
- By default, data for the last 15 minutes is queried and displayed. If you want to query log data in other time ranges, set the query time and click Query/Analyze.
Creating a Quick Query
- Log in to the management console.
- Click in the upper part of the page and choose Security > SecMaster.
- In the navigation pane on the left, choose Workspaces > Management. In the workspace list, click the name of the target workspace.
Figure 8 Workspace management page
- In the navigation pane on the left, choose . The security analysis page is displayed.
Figure 9 Accessing the Security Analysis tab page
- In the data space navigation tree on the left, click a data space name to show the pipeline list. Click a pipeline name. On the displayed page, you can search the pipeline data.
Figure 10 Pipeline data page
- Enter the query and analysis statement, set the time range, and click Query/Analyze.
For details, see Executing a Query and Analysis Based on Query Criteria.
- Click Save As Quick Query in the upper right corner of the area and configure query parameters on the right.
Table 1 Parameters for a quick query Parameter
Description
Query Name
Specify the name of the quick query.
Query statement
The system automatically generates the query statement entered in 6.
- Click OK.
After creating a quick query, you can click
 in the quick query search box on the pipeline data query and analysis page and select the target quick query name to use the quick query.
Managing Query and Analysis Results
SecMaster displays query and analysis results in the form of log distribution bar charts, Raw Logs, and Charts.
- Log distribution bar chart
A bar chart is used to display queried logs over time. You can move the cursor to a certain bar to view the number of logs hit at the time the bar represents.
- Raw Logs
The Raw Logs tab displays the results of the current query.
- To display log data over time:
- By default, log data in the last 15 minutes is displayed. To display data in other time, select the time range in the upper right corner.
- To view data of all fields at a specified time, click
 in front of the time in the table to expand all data. By default, data is displayed in a table.
To view data in JSON format, click the JSON tab. Data in JSON format is displayed on the page.
- To display or filter some fields in the list, select the fields to be displayed in the Available Fields area on the right and click
 next to the field name. The fields are displayed in the log data list on the right.
- To adjust the field sequence: In the heading columns of the log data list on the right, select a field and then click
 or
or  next to the field name to move the field left or right by one column with each click.
 - To cancel the display: In the table header column of the log data list on the right, select the target field, and click
 next to the field name, or click
  next to the field name on the left.
- To adjust the field sequence: In the heading columns of the log data list on the right, select a field and then click
- To export logs: On the Raw Logs tab page, click
 in the upper right corner of the page. The system automatically downloads raw logs to the local PC.
- To display log data over time:
- Charts
After a query statement is executed, you can view visualized query analysis results on the Charts tab.
On the Charts tab, SecMaster provides query and analysis results in multiple chart types, such as tables, line charts, bar charts, and pie charts. For details, see Viewing Results in a Chart.
- Alarm
In the upper right corner of the Analyze & Query tab, click Add Alarm to add alert models. You can set alert rules for generating alerts for query and analysis results hit the rules. For details, see Quickly Adding a Log Alert Model.
- Quick Query
In the upper right corner of the query analysis page, click Save As Quick Query to save search criteria as a quick query. For details, see Creating a Quick Query.
Feedback
Was this page helpful?
Provide feedbackThank you very much for your feedback. We will continue working to improve the documentation.See the reply and handling status in My Cloud VOC.
For any further questions, feel free to contact us through the chatbot.
Chatbot


