
Quickly Adding a Log Alert Model
Scenario
You can configure alert models for query and analysis results. In doing this, the model can generate alerts when the results match the trigger conditions.
This topic describes how to quickly configure alarm models for logs.
Prerequisites
Data access has been completed. For details, see Data Integration.
Quickly Adding a Log Alert Model
- Log in to the management console.
- Click
 in the upper part of the page and choose Security > SecMaster.
 - In the navigation pane on the left, choose Workspaces > Management. In the workspace list, click the name of the target workspace.
Figure 1 Workspace management page

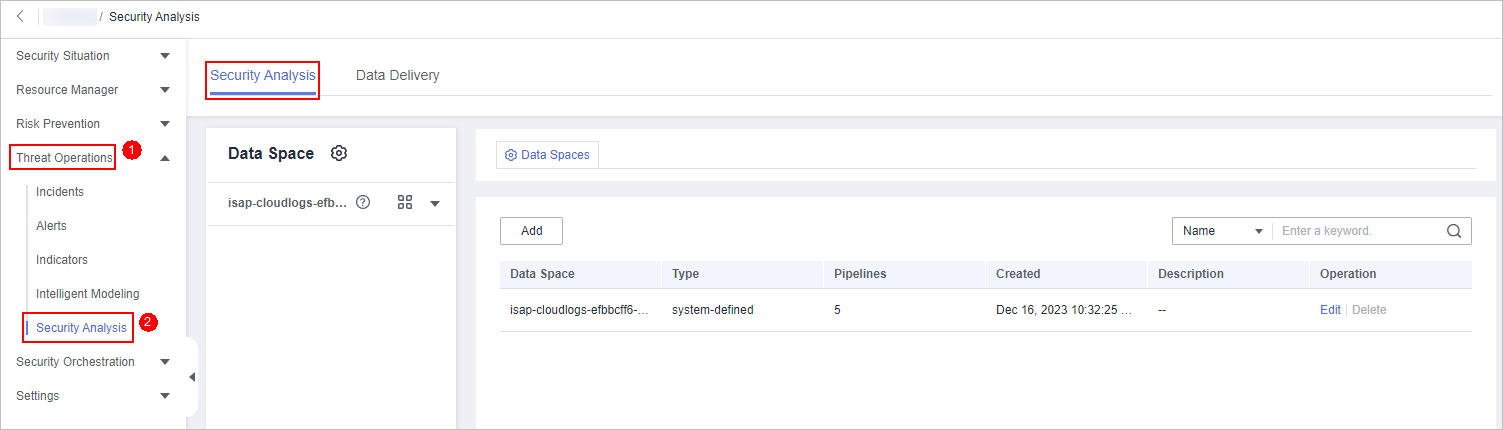
- In the navigation pane on the left, choose . The security analysis page is displayed.
Figure 2 Accessing the Security Analysis tab page
- In the data space navigation tree on the left, click a data space name to show the pipeline list. Click a pipeline name. On the displayed page, you can search the pipeline data.
Figure 3 Pipeline data page
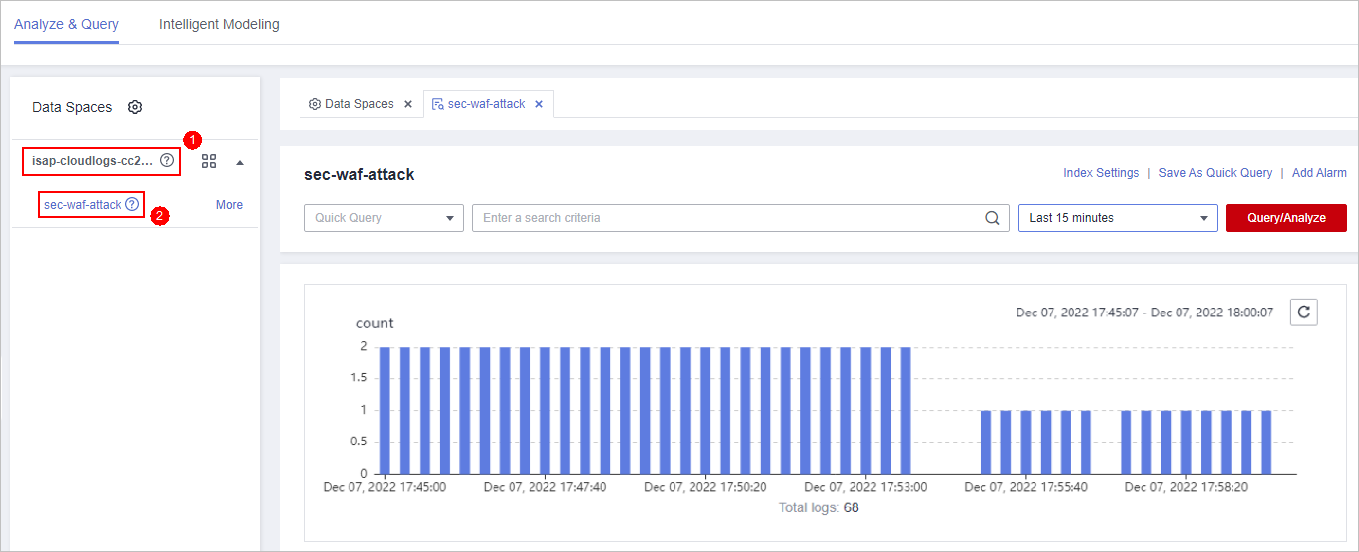
- Enter the query analysis statement, set the time range, and click Query/Analyze. The query analysis result is displayed.
For details, see Querying and Analyzing Logs.
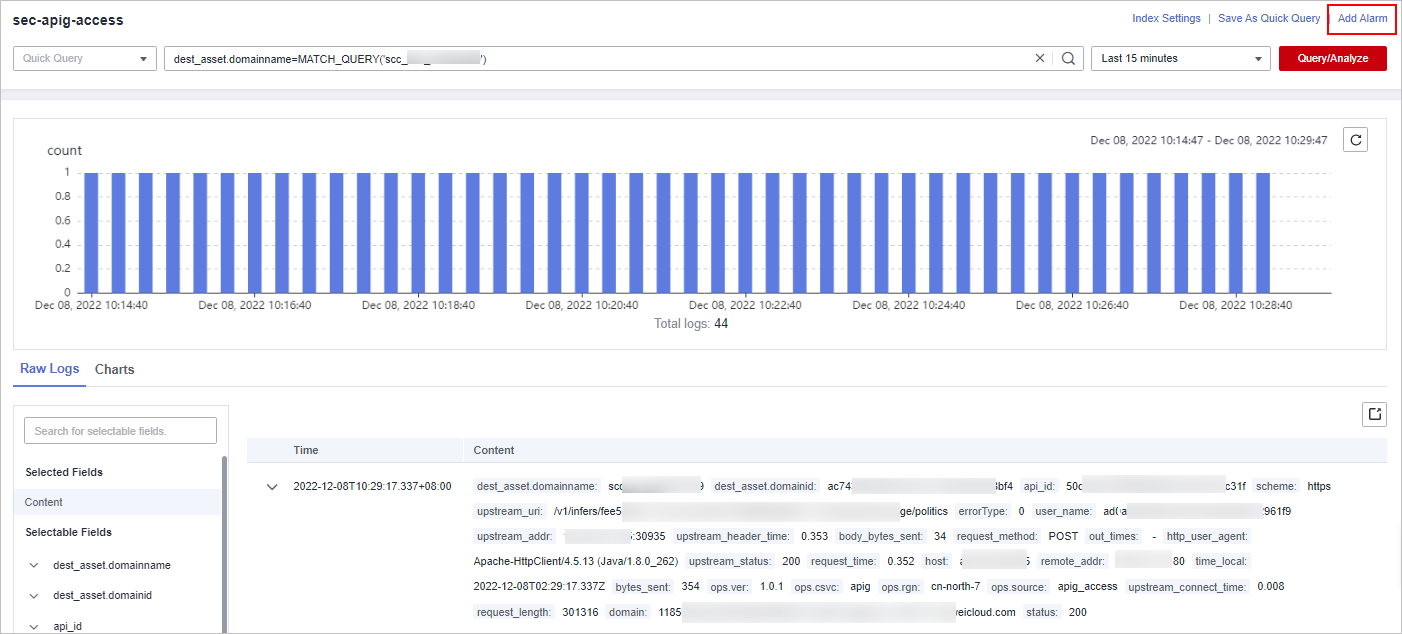
- Click Add Alarm in the upper right corner of the page. The Create Alarm Model page is displayed.
Figure 4 Add Alarm
- Configure basic alarm information by referring to Table 1.
Table 1 Basic parameters of an alarm model Parameter
Description
Pipeline Name
The pipeline where the alert model is executed, which is generated by the system by default.
Model Name
Name of the alarm model.
Severity
Severity of alarms reported by the alarm model. You can set the severity to Critical, High, Medium Low, or Informative.
Alarm Type
Alarm type displayed after the alarm model is triggered.
Model Type
The default value is Rule model.
Description
Enter the description of the alarm model.
Status
The alarm model status.
You can change the alarm model status after the model is configured.
- After the setting is complete, click Next in the lower right corner of the page. The page for setting the model logic is displayed.
- Set the model logic. For details about the parameters, see Table 2.
Table 2 Configure Model Logic Parameter
Description
Query Rule
Set alert query rules. After the setting is complete, click Run and view the running result.
A query analysis statement consists of a query statement and an analysis statement. The format is Query Statement|Analysis Statement. For details about the syntax of query analysis statements, see Query and Analysis Syntax Overview.NOTE:If the reserved field is of the text type, MATCH_QUERY is used for word segmentation queries by default.
Query Plan
Set an alert query plan.
- Running query interval: xx minutes/hour/day.
If the running query interval is minute, set this parameter to a value ranging from 5 to 59 minutes. If the running query interval is hour, set this parameter to a value ranging from 1 to 23 hours. If the running query interval is day, set this parameter to a value ranging from 1 to 14 days.
- Time window: xx minutes/hour/day.
If the time window is minute, the value ranges from 5 minutes to 59 minutes. If the time window is hour, the value ranges from 1 hour to 23 hours. If the time window is day, the value ranges from 1 day to 14 days.
- Execution Delay: xx minutes. The value ranges from 0 to 5 minutes.
Advanced Alarm Settings
- Custom Information: Customize extended alert information.
Click Add, and set the key and value information.
- Alarm Details: Enter the alarm name, description, and handling suggestions.
Trigger Condition
Sets alert triggering conditions. The value can be greater than, equal to, not equal to, or less than xx.
If there are multiple trigger conditions, click Add and add them. A maximum of five trigger conditions can be added.
If there are multiple trigger conditions, SecMaster scans log data to hit each trigger condition from top to bottom and generates all types of alerts for hit trigger conditions.
Alarm Trigger
The way to trigger alerts for queried results. The options are as follows:
- One alert for all query results
- One alert for each query result
Debugging
Sets whether to generate debugging alarms.
Suppression
Specifies whether to stop the query after an alert is generated.
- If Suppression is enabled, the query stops after an alert is generated.
- If Suppression is disabled, the query is not stopped after an alert is generated.
- Running query interval: xx minutes/hour/day.
- After the setting is complete, click Next in the lower right corner of the page. The model details preview page is displayed.
- After confirming that the preview is correct, click OK in the lower right corner of the page to confirm the configuration.
Feedback
Was this page helpful?
Provide feedbackThank you very much for your feedback. We will continue working to improve the documentation.See the reply and handling status in My Cloud VOC.
For any further questions, feel free to contact us through the chatbot.
Chatbot


