Smooth Migration from Prometheus to Cloud Native Cluster Monitoring
The Prometheus add-on (Prometheus (EOM)) can only be installed in clusters v1.21 or earlier. If you upgrade a cluster to v1.21 or later, you need to migrate the data from the Prometheus add-on to the Cloud Native Cluster Monitoring add-on (Cloud Native Cluster Monitoring) to obtain technical support. This section describes how to migrate the data from the Prometheus add-on that has been end of maintenance to the Cloud Native Cluster Monitoring add-on.
The following table lists the differences between the Cloud Native Cluster Monitoring add-on and the Prometheus add-on:
|
Cloud Native Cluster Monitoring |
Prometheus (End of Maintenance) |
|---|---|
|
|
Migration Solution
There are multiple solutions for migrating the data from the Prometheus add-on to the Cloud Native Cluster Monitoring add-on. You can select the most appropriate solution based on your requirements.
The Cloud Native Cluster Monitoring add-on can be deployed either in the lightweight mode without local data storage (recommended) or the traditional mode with local data storage.
- In the lightweight mode, metrics are stored in AOM. Your applications like Grafana need to be connected to AOM. In this mode, the resource usage in a cluster is low, which greatly reduces your compute and storage costs. During AOM billing, basic metrics are free, but custom metrics are billed on the pay-per-use basis. You can discard custom metrics as needed and keep only the basic ones.

This mode does not support HPA based on custom Prometheus statements.
- When deployed in the traditional mode, the Cloud Native Cluster Monitoring add-on is much like the Prometheus add-on. However, this mode requires a large amount of compute and storage resources to store data in a cluster, making it unsuitable for large-scale clusters with over 400 nodes.
For lower costs but higher reliability, the lightweight mode is recommended.
Prerequisites
- The cluster version is v1.21.
- The Prometheus add-on has been upgraded to the latest version.
- The Cloud Native Cluster Monitoring add-on version is 3.10.1 or later.
Migrating Collected Data
- When you migrate the data from the Prometheus add-on to the Cloud Native Cluster Monitoring add-on that is deployed in the traditional mode, the database is automatically migrated. You only need to focus on collection configuration.
- When you migrate data of the Prometheus add-on to the Cloud Native Cluster Monitoring add-on deployed in the lightweight mode, the data collected by the Prometheus add-on will be stored in the cluster PVC, and the data collected by the Cloud Native Cluster Monitoring add-on will be stored in AOM. In this case, data cannot be directly migrated. However, you can still leverage historical data aging to smoothly migrate your local data to AOM as follows:
- Migrate data to the Cloud Native Cluster Monitoring add-on that is deployed in the traditional mode and connect this add-on to the Prometheus instance on AOM for smooth migration.
You can directly query the data that was collected by the Prometheus add-on and stored in the cluster PVC. The data collected by the Cloud Native Cluster Monitoring add-on will be stored in both the cluster PVC and AOM.
- After the historical data is aged, the data in AOM will be the same as that in the cluster PVC. (For example, if the storage duration of data in the cluster PVC is set to seven days, the data in AOM will be the same as that in the cluster PVC seven days later.)
- Change the Cloud Native Cluster Monitoring add-on to the lightweight mode. In this way, you can save compute and storage resources and store monitoring data in AOM.
- After confirming that the data in AOM meets the expectation and connecting your Grafana to AOM, delete the PVC (whose name contains prometheus-server) in the monitoring namespace.
- Migrate data to the Cloud Native Cluster Monitoring add-on that is deployed in the traditional mode and connect this add-on to the Prometheus instance on AOM for smooth migration.
Migrating Collection Configuration
- Migrate Prometheus configuration.

If you have never modified the ConfigMap named prometheus in the monitoring namespace, skip this step.
- Run the following command to back up the data collected by the Prometheus add-on:
kubectl get cm prometheus -nmonitoring -oyaml > prometheus.backup.yaml
- Create a secret for additional-scrape-configs in the monitoring namespace and add the custom collection configuration in scrape_configs to the secret. (Do not add jobs kubernetes-cadvisor, kubernetes-nodes, kubernetes-service-endpoints, kubernetes-pods, and istio-mesh to the secret. Otherwise, duplicate metrics will be collected.)
Example secret content:
kind: Secret apiVersion: v1 type: Opaque metadata: name: additional-scrape-configs namespace: monitoring stringData: prometheus-additional.yaml: |- - job_name: custom-job-tes metrics_path: /metrics relabel_configs: - action: keep source_labels: - __meta_kubernetes_pod_label_app - __meta_kubernetes_pod_labelpresent_app regex: (prometheus-lightweight);true - action: keep source_labels: - __meta_kubernetes_pod_container_port_name regex: web kubernetes_sd_configs: - role: pod namespaces: names: - monitoring - After the Cloud Native Cluster Monitoring add-on is installed, set persistence parameters.
kubectl edit cm persistent-user-config -nmonitoring
Add - --common.prom.default-additional-scrape-configs-key=prometheus-additional.yaml under operatorConfigOverride.apiVersion: v1 data: lightweight-user-config.yaml: | customSettings: additionalScrapeConfigs: [] agentExtraArgs: [] metricsDeprecated: globalDeprecateMetrics: [] nodeExporterConfigOverride: [] operatorConfigOverride: - --common.prom.default-additional-scrape-configs-key=prometheus-additional.yaml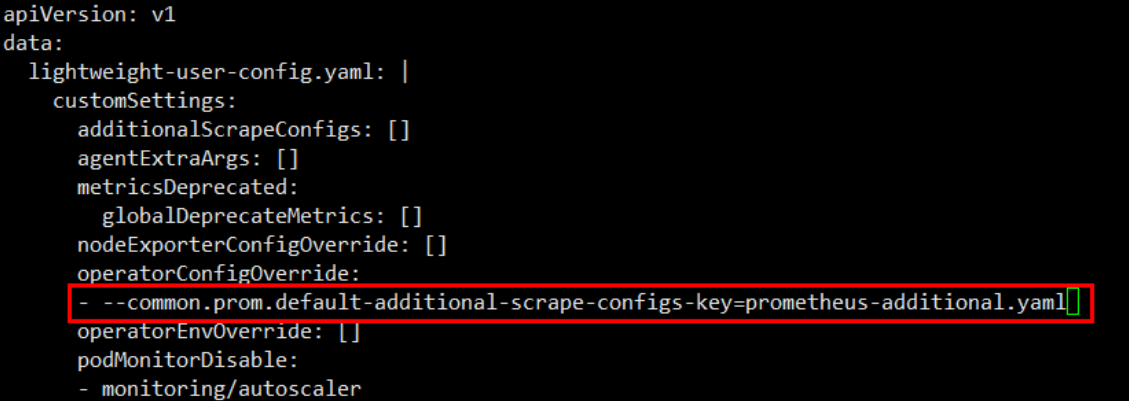
- Save the change and exit. Wait for about 1 minute. You can view your custom collection task on the Grafana or AOM page.
- Run the following command to back up the data collected by the Prometheus add-on:
- Configure custom collection tasks in the kube-system and monitoring namespaces.

If your custom metrics are collected using annotation-based automatic discovery and are not in the kube-system and monitoring namespaces, skip this step.
To prevent repeated collection and ensure that only basic metrics are collected, the Cloud Native Cluster Monitoring add-on does not automatically discover collection tasks in the kube-system and monitoring namespaces by default. You need to set the ServiceMonitor or PodMonitor.
For example, the following PodMonitor collects metrics of the pod labeled with app: test-app from /metrics over port metrics.
apiVersion: monitoring.coreos.com/v1 kind: PodMonitor metadata: labels: component: controller managed-by: prometheus-operator metrics: cceaddon-nginx-ingress name: nginx-ingress-controller namespace: monitoring spec: jobLabel: nginx-ingress namespaceSelector: matchNames: - monitoring podMetricsEndpoints: - interval: 15s path: /metrics port: metrics relabelings: - action: drop regex: "true" sourceLabels: - __meta_kubernetes_pod_container_init tlsConfig: insecureSkipVerify: true selector: matchLabels: app: test-app - Extend the metrics of preset collection tasks.

If you use only common metrics of kubelet, cadiviser, node-exporter, and kube-state-metrics and these metrics are included in the basic metrics of the Cloud Native Cluster Monitoring add-on, skip this step.
View the preset ServiceMonitor.
kubectl get servicemonitor -nmonitoring
View the preset PodMonitor.
kubectl get podmonitor -nmonitoring
- The kubelet and cadiviser metrics are controlled by ServiceMonitor kubelet.
- The node-exporter metrics are controlled by ServiceMonitor node-exporter.
- The kube-state-metrics metrics are controlled by ServiceMonitor kube-state-metrics.
To expand the metric whitelist, edit the corresponding ServiceMonitor or PodMonitor.

Generally, the edited ServiceMonitor or PodMonitor settings are not affected during the add-on upgrade, but may be overwritten. Before upgrading the add-on, back up related modifications and manually confirm the modifications after the upgrade.
- Extend cadiviser metrics.
- Run the following command to edit ServiceMonitor kubelet:
kubectl edit servicemonitor kubelet -nmonitoring
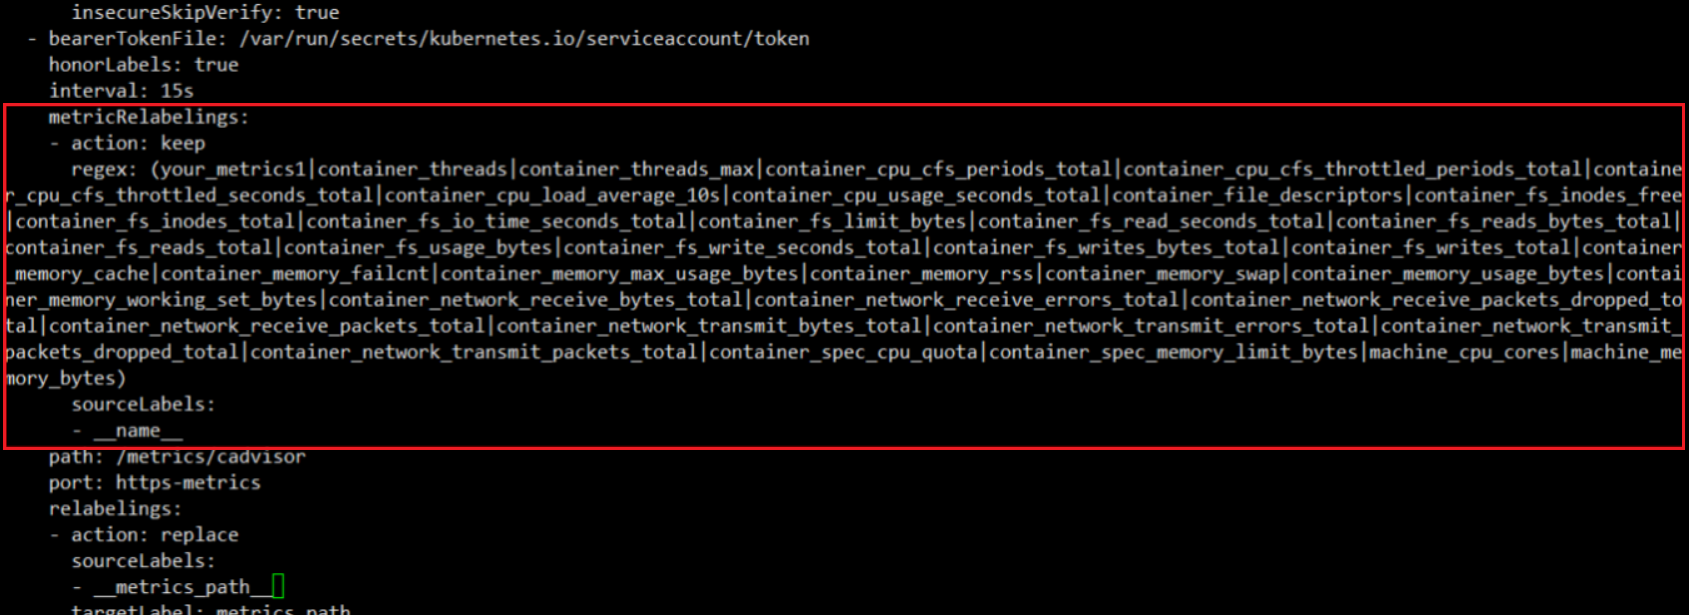
- (ServiceMonitor kubelet contains two endpoints: kubelet and cadiviser.) Find the whitelist of cadiviser and add metrics as needed. (You are advised not to delete existing metrics from the whitelist. Existing metrics are free. Deleting them may affect the functions on the container intelligent analysis page.) In the following figure, the your_metrics1 metric has been added.

- To collect all ServiceMonitor kubelet metrics, delete the metricRelabelings content (highlighted in red in the following figure).
If you need to expand the kubelet metrics, edit the kubelet metrics.
- Run the following command to edit ServiceMonitor kubelet:
- Extend kube-state-metrics metrics.
- Run the following command to edit ServiceMonitor kube-state-metrics. The procedure for extending kube-state-metrics metrics is similar to that for extending cadiviser metrics. ServiceMonitor kube-state-metrics has only one endpoint, which can be directly edited.
kubectl edit servicemonitor kube-state-metrics -nmonitoring
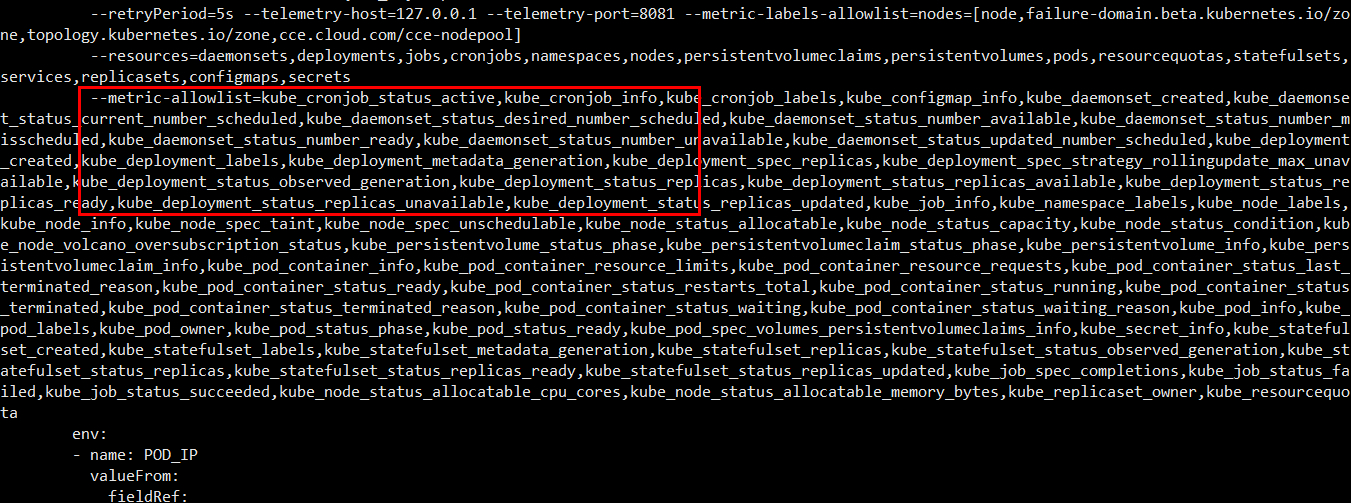
- Modify the metric exposure content in the startup command of the kube-state-metrics workload, add the required metrics, and separate them with commas (,).
kubectl edit deploy kube-state-metrics -nmonitoring
- Save the change and exit.
- Run the following command to edit ServiceMonitor kube-state-metrics. The procedure for extending kube-state-metrics metrics is similar to that for extending cadiviser metrics. ServiceMonitor kube-state-metrics has only one endpoint, which can be directly edited.
- Extend node-exporter metrics.
- Run the following command to edit ServiceMonitor node-exporter. The procedure for extending node-exporter metrics is similar to that for extending cadiviser metrics. ServiceMonitor node-exporter has only one endpoint, which can be directly edited.
kubectl edit servicemonitor node-exporter -nmonitoring
You can enable more collectors if needed. For details, see the collector metric description.
- Run the following command to check whether the collector of the node-exporter provided by the Cloud Native Cluster Monitoring add-on is enabled. (To reduce resource consumption, the Cloud Native Cluster Monitoring add-on disables more collectors than the community.)
kubectl get ds node-exporter -nmonitoring -oyaml
- Confirm that the collector has been enabled and then run the following command to edit the ConfigMap:
kubectl edit cm persistent-user-config -nmonitoring
To remove a masked item from the Cloud Native Cluster Monitoring add-on, add drop: <Masked item> under nodeExporterConfigOverride. For example, if you want to enable ARP metric collection, configure drop:--no-collector.arp. Example:
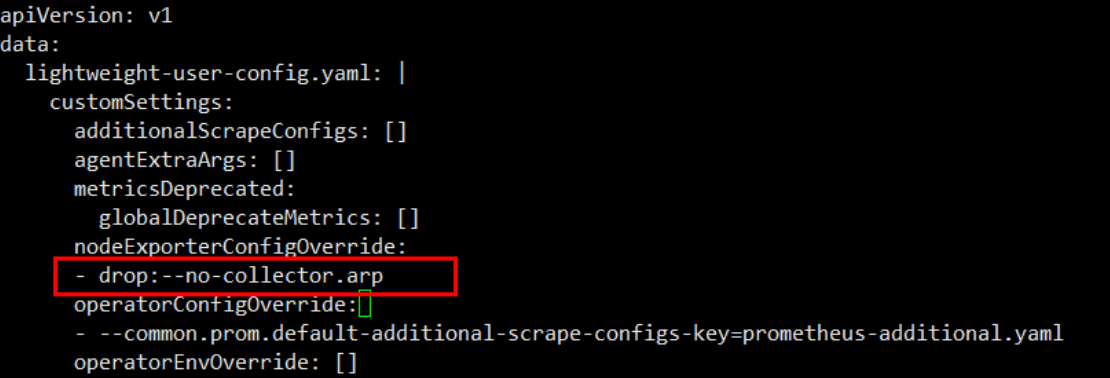
- Save the change and exit. The node-exporter workload is being upgraded in rolling mode. After the upgrade is complete, check the startup parameters of node-exporter. It is found that --no-collector.arp has been removed.
kubectl get ds node-exporter -nmonitoring -oyaml

- To add a collection item, configure the startup parameters in the ConfigMap. For example, to enable softirqs collection, run the following command to edit the ConfigMap:
kubectl edit cm persistent-user-config -nmonitoring
Add --collector.softirqs under nodeExporterConfigOverride.
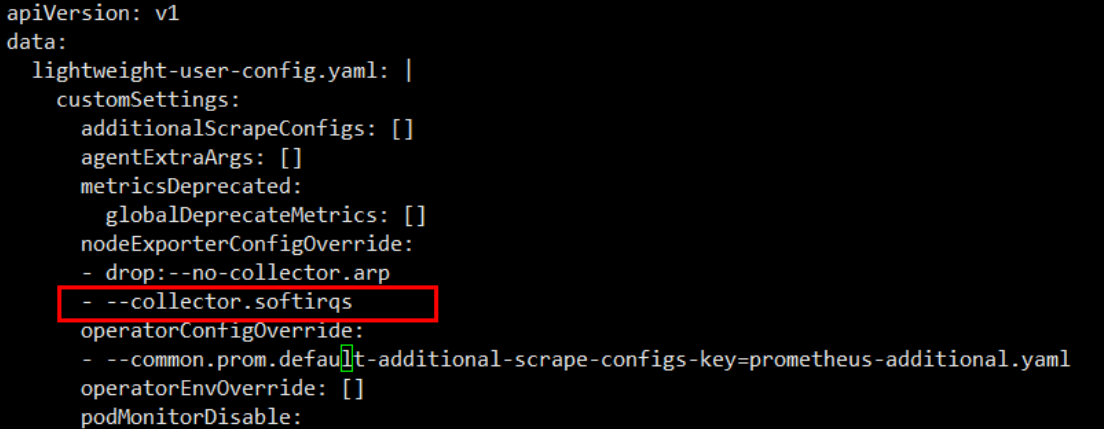
- Save the change and exit. The node-exporter workload is being upgraded in rolling mode. After the upgrade is complete, check the startup parameters of node-exporter. It is found that --collector.softirqs has been specified, and node-exporter starts to expose the softirqs metric.
kubectl get ds node-exporter -nmonitoring -oyaml

- Run the following command to edit ServiceMonitor node-exporter. The procedure for extending node-exporter metrics is similar to that for extending cadiviser metrics. ServiceMonitor node-exporter has only one endpoint, which can be directly edited.
Verifying the Migration
After the migration is complete, you can view your metrics on Grafana or AOM. If any metrics or tags do not meet your expectation, submit a service ticket to contact technical support.
If your configuration is complex and you are not sure how to migrate it, submit a service ticket to contact technical support.
Feedback
Was this page helpful?
Provide feedbackThank you very much for your feedback. We will continue working to improve the documentation.See the reply and handling status in My Cloud VOC.
For any further questions, feel free to contact us through the chatbot.
Chatbot

