
Help Center/
Relational Database Service_RDS for MySQL/
User Guide/
Problem Diagnosis and SQL Analysis/
SQL Analysis/
Viewing Top SQL Statements of a DB Instance
Updated on 2025-11-05 GMT+08:00
Viewing Top SQL Statements of a DB Instance
Scenarios
Top SQL shows the SQL queries that have been contributing the most to DB load. You can sort them by multiple dimensions.
Procedure
- Click
 in the upper left corner and select a region.
 - Click
 in the upper left corner of the page and choose Databases > Relational Database Service.
 - On the Instances page, click the target instance name to go to the Summary page.
- In the navigation pane, choose SQL Analysis and Tunning under DBA Assistant.
- Click the Top SQL tab.
This function is only available with Advanced DBA Assistant.
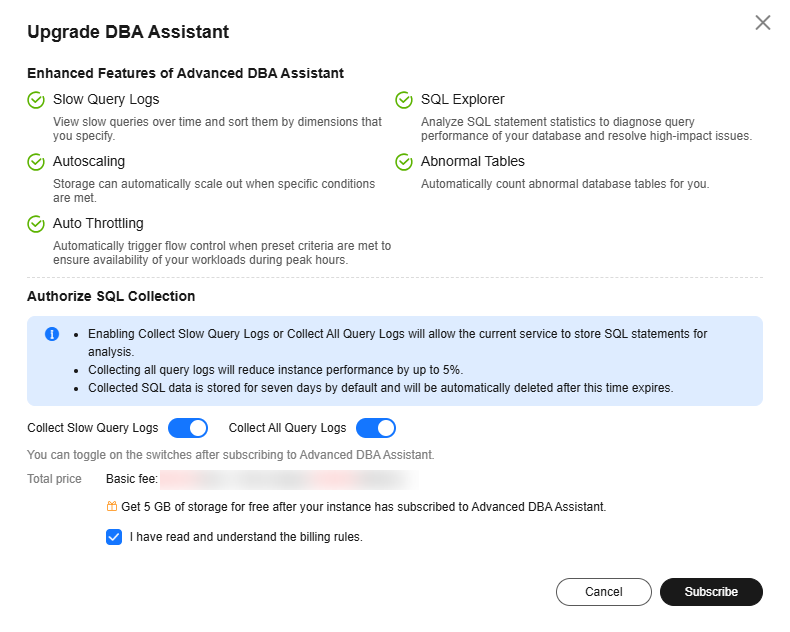
- Click Upgrade DBA Assistant. In the displayed dialog box, you can learn about the enhanced features and billing rules.
Figure 1 Upgrading DBA Assistant
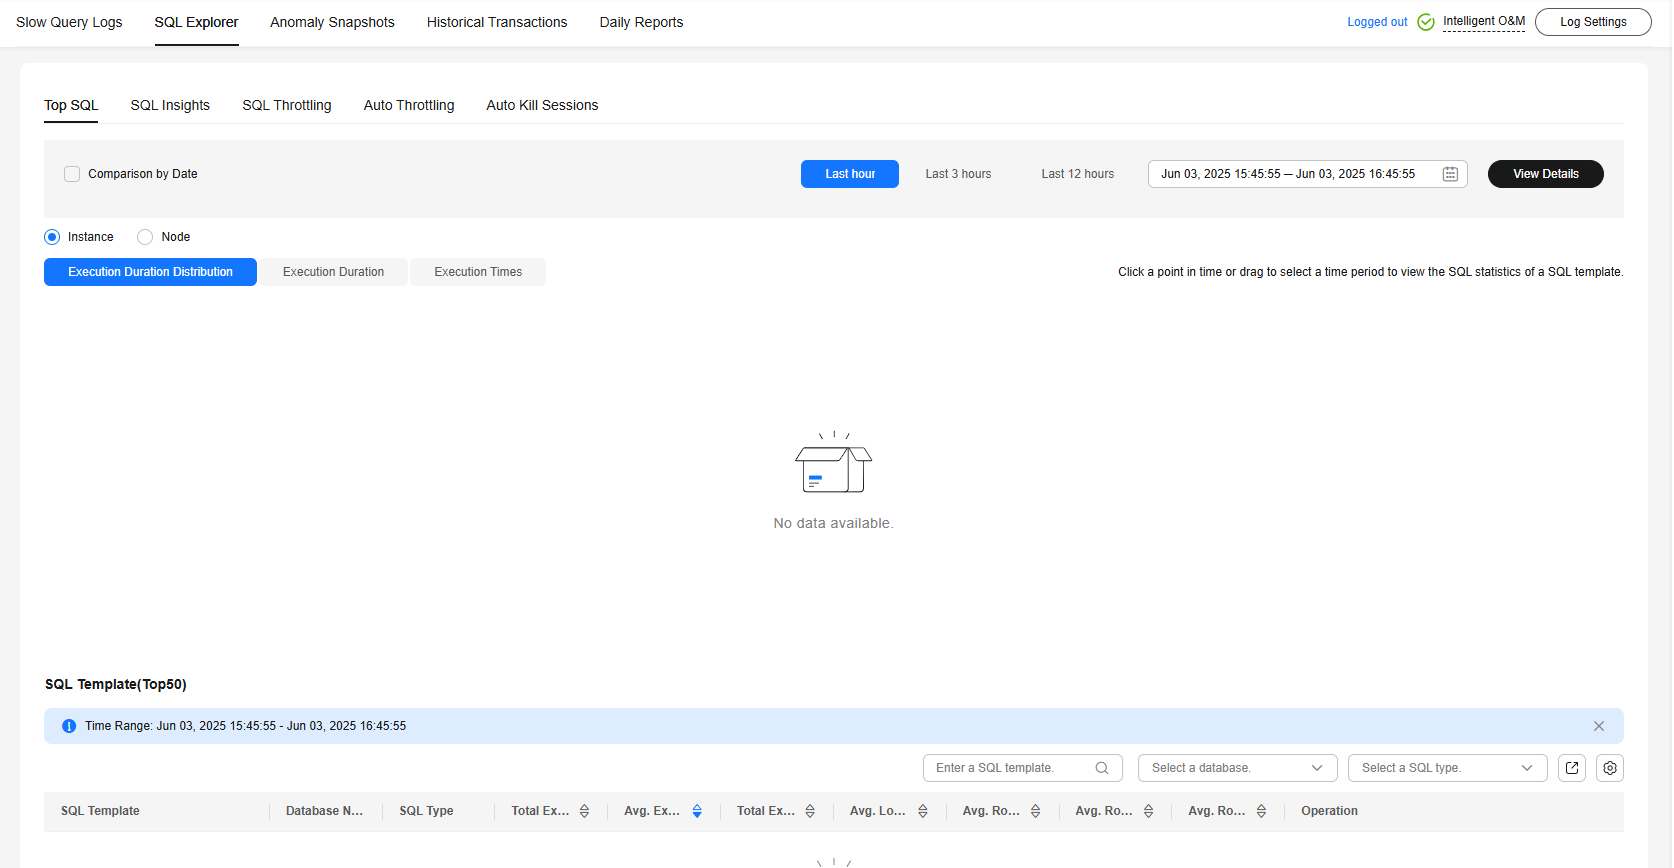
- After the upgrade is complete, view top SQL statements of your instance.
- View execution durations of the top SQL statements in the last 1 hour, last 3 hours, last 12 hours, or a custom time period (spanning no more than one day).
Feedback
Was this page helpful?
Provide feedbackThank you very much for your feedback. We will continue working to improve the documentation.See the reply and handling status in My Cloud VOC.
The system is busy. Please try again later.
For any further questions, feel free to contact us through the chatbot.
Chatbot


