
Viewing Full SQL Statistics Using SQL Explorer
Scenarios
SQL Explorer collects and stores all SQL statements executed on your GaussDB instance. This allows you to review SQL statement metrics, execution details, and other related information.
You can configure SQL Explorer to collect data at the instance level, for example, determine whether to filter out system users, specify the default data retention period, and select the types of SQL statements to be collected.
You can also identify table names in SQL text using table definition query or query the table definition based on the table name, schema name, and database name.
Prerequisites
- You have logged in using an account assigned the gaussdb:instance:listFullSql and gaussdb:instance:operateFullSql actions.
- The login account must be assigned the API actions lts:groups:*, lts:topics:*, and lts:logs:list of Log Tank Server (LTS).
- The full SQL statistics and table definition functions are only available for authorized users.
- LTS is running properly.
- The CCMS service has been connected for managing built-in accounts of LTS.
Constraints
- To enable SQL Explorer, the DB engine version of GaussDB instances must be V2.0-8.0.1 or later, and the kernel version must be 505.0.0 or later.
- The GaussDB instance and all its nodes to be collected must be in the available state.
- Batch collection and reporting of full SQL data to LTS may be delayed by up to 2 minutes and is not real-time. High concurrency may result in some minor data loss.
- You can query full SQL data generated in the past 30 days.
- Collected data will be automatically deleted upon expiration. You can set the retention period according to your business needs, from a minimum of 1 day to a maximum of 30 days. Expired data cannot be queried.
- Enabling SQL Explorer may temporarily affect database performance.
- Enabling SQL Explorer will automatically connect your instance to LTS. All collected SQL records are continuously stored in LTS (100% indexed fields), which will continuously incur costs. For pricing details of LTS, see Product Pricing Details.
- Ensure that the time (the timestamp of UTC-0) of the management plane node is synchronized with that of each instance node. The time difference cannot exceed 10 seconds. Otherwise, the functionality will be affected.
- Before deleting a GaussDB instance, manually disable SQL Explorer. If you do not need the collected full SQL data, log in to LTS and manually delete the corresponding log group or log stream.
- Table definition query is available for instances whose DB engine version is V2.0-3.208.0 or later and kernel version is 503.1.0.SPC1200 or later. For details about how to query the version, see Checking the DB Engine and Kernel Engine Version of a GaussDB Instance.
Enabling SQL Explorer
- Log in to the management console.
- Click
 in the upper left corner and select a region and project.
 - Click
 in the upper left corner of the page and choose .
 - On the Instances page, click the name of the target instance to go to the Basic Information page.
- Choose Diagnostics and Optimization > SQL Diagnosis.
- Click the SQL Explorer tab. On the displayed page, click
 next to Enable SQL Explorer. In the displayed dialog box, configure the parameters for collecting full SQL data.
Figure 1 Enabling SQL Explorer
next to Enable SQL Explorer. In the displayed dialog box, configure the parameters for collecting full SQL data.
Figure 1 Enabling SQL Explorer
- Retention Period of Full SQL Data: Set the number of days for storing collected full SQL data in LTS. Expired data will be automatically deleted. The default value is 7 days. You can set a value from 1 to 30.
- Filter System Users: Toggle this option on if you want to ignore all SQL statements executed by system users during data collection. It is toggled on by default.
- LTS Log Group: Select the log group dedicated to intelligent O&M. Each instance is configured independently as required. When SQL Explorer is enabled, a log group is created automatically. After an instance is deleted, if the log group is no longer needed, you can manually delete it on the LTS console. For details, see Deleting a Log Group.
- LTS Log Stream: Select the log stream dedicated to SQL Explorer. Each instance is configured independently as required. When SQL Explorer is enabled, a log stream is created and configured automatically.
- SQL Types: Select the types of SQL statements to be collected. You can add custom types with the Custom option.
- Click OK.
Wait until the system displays a message indicating that SQL Explorer is enabled.
Viewing Full SQL Statistics
- Log in to the management console.
- Click in the upper left corner and select a region and project.
- Click in the upper left corner of the page and choose .
- On the Instances page, click the name of the target instance to go to the Basic Information page.
- Choose Diagnostics and Optimization > SQL Diagnosis and click the SQL Explorer tab.
- On the Full SQL Statistics tab of the SQL Explorer page, click
 to query statistics of normalized SQL records. By default, data from the last hour is displayed.
You can adjust search criteria to narrow down results and precisely target specific records. For example, you can modify the time range and combine filters such as SQL text (up to 5 entries), normalized SQL ID, and other extended fields.Figure 2 Adding search criteria
to query statistics of normalized SQL records. By default, data from the last hour is displayed.
You can adjust search criteria to narrow down results and precisely target specific records. For example, you can modify the time range and combine filters such as SQL text (up to 5 entries), normalized SQL ID, and other extended fields.Figure 2 Adding search criteria
- Expand a row to view the aggregated SQL execution records of the specified normalized SQL ID.
Figure 3 Querying all SQL execution records of a normalized SQL ID

- You can apply secondary filtering in the expanded list to narrow down and accurately locate specific records.
- The system does not support backend pagination for list queries. By default, it returns up to 200 records at once (controlled by the parameter LIST_FULL_SQL_PAGE_LIMIT; default value: 200). The frontend then displays these records on different pages. If the number of records exceeds 200, narrow your search scope to quickly locate the target record.
- The current sorting function is based on cached sorting of the records displayed on the page (up to 200 records).

On the Full SQL Statistics tab page, you can:
- View SQL statistics aggregated by normalized SQL ID (corresponding kernel field: unique_sql_id).
- Expand a normalized SQL ID to view the execution records of the SQL statement on the execution entry component.
- The execution entry component refers to the first component where SQL statements are executed in an instance. For distributed instances, a CN is the execution entry component. For centralized instances, a DN is the execution entry component. The execution records whose application name starts with cn_ are excluded.
- Precompiled SQL statements (whose unique SQL IDs are 0) in the parsing phase are not displayed.
- Click View SQL in the Operation column to view the collected SQL text and the parsed original SQL text.
When track_stmt_parameter is enabled, variables in the collected SQL text are replaced with their actual values, so you can see the original SQL statement. However, for SQL text collected when track_stmt_parameter is disabled, the original values of the variables cannot be retrieved, and no content will be displayed here. For details about how to modify parameters, see Modifying Instance Parameters.
- Click More and choose View More in the Operation column of a SQL record to view other parameter details of it. The system only displays details about SQL execution on the execution entry component.
Figure 4 Querying SQL execution details on the entry component

- Click More and choose Trace Full Link in the Operation column of a SQL record to view SQL execution details on each component. For a distributed instance, the system displays SQL execution details on CNs and DNs.
- Click More and choose View Execution Time in the Operation column of a SQL record to check how long the SQL record took to execute on the entry component.
Figure 5 Querying SQL execution duration on the entry component

To view the end-to-end SQL execution duration on all involved components, click More and choose View Full Link Duration. For details, see Performing Full-Link Analysis for a SQL Record.
Viewing Full Data by SQL Statement
- Log in to the management console.
- Click in the upper left corner and select a region and project.
- Click in the upper left corner of the page and choose .
- On the Instances page, click the name of the target instance to go to the Basic Information page.
- Choose Diagnostics and Optimization > SQL Diagnosis and click the SQL Explorer tab.
- Click the Full Data by SQL Statement tab on the SQL Explorer page. On the displayed tab, click
 to query all SQL records in a specified period. By default, data from the last hour is displayed.
Figure 6 Querying full data by SQL statement
to query all SQL records in a specified period. By default, data from the last hour is displayed.
Figure 6 Querying full data by SQL statement
You can adjust search criteria to narrow down results and precisely target specific records. For example, you can modify the time range or apply combined filters such as SQL text and valid DB time.
- SQL text: You can enter up to five SQL statement snippets at a time.
- Valid DB time, CPU time, I/O time, and executor execution time: You can specify a time range to filter results.
Figure 7 Adding search criteria
On the Full Data by SQL Statement page, you can:
- View execution records of SQL statements on the execution entry component. For distributed instances, only SQL statements executed on CNs are displayed.
- Click a unique SQL ID to view the complete execution link details of the SQL statement. For distributed instances, SQL statements executed on CNs and DNs are displayed.
- The execution entry component refers to the first component where SQL statements are executed in an instance. For distributed instances, a CN is the execution entry component. For centralized instances, a DN is the execution entry component. The execution records whose application name starts with cn_ are excluded.
- Precompiled SQL statements (whose unique SQL IDs are 0) in the parsing phase are not displayed.
- For a distributed instance, the valid DB time, CPU time, I/O time, and execution time in an executor reflect the time spent on a single component, not the total execution time across all components involved in the full SQL execution link.
You can choose More > Trace Full Link in the Operation column to view the brief duration statistics and SQL hit ratio statistics of the full SQL execution link. You can also choose More > View Full Link Duration in the Operation column to view the detailed duration distribution of the full SQL execution link.
- Click View SQL in the Operation column to view the collected SQL text and the parsed original SQL text.
When track_stmt_parameter is enabled, variables in the collected SQL text are replaced with their actual values, so you can see the original SQL statement. However, for SQL text collected when track_stmt_parameter is disabled, the original values of the variables cannot be retrieved, and no content will be displayed here. For details about how to modify parameters, see Modifying Instance Parameters.
- Click More and choose View More in the Operation column of a SQL record to view other parameter details of it. The system only displays details about SQL execution on the execution entry component.
Figure 8 Querying SQL execution details on the entry component
- Click More and choose Trace Full Link in the Operation column to view the execution details of the complete SQL link on each component and statistics such as the time required for each phase. For a distributed instance, you can view the SQL statement execution details on CNs and DNs.
- Click More and choose View Execution Time in the Operation column of a SQL record to check how long the SQL record took to execute on the entry component.
Figure 9 Querying SQL execution duration on the entry component

- Click More and choose View Full Link Duration in the Operation column of a SQL record to check how long the SQL record took to execute on all involved components.
Figure 10 Viewing the SQL execution duration on all involved components

For details about link parameters and additional information, see Performing Full-Link Analysis for a SQL Record.
Modifying Default Settings
- Log in to the management console.
- Click in the upper left corner and select a region and project.
- Click in the upper left corner of the page and choose .
- On the Instances page, click the name of the target instance to go to the Basic Information page.
- Choose Diagnostics and Optimization > SQL Diagnosis.
- On the SQL Explorer page, click Modify Default Settings. In the displayed dialog box, modify the SQL Explorer configuration parameters.
Figure 11 Modifying the default settings of SQL Explorer

- Click OK.
- Wait until the system displays a message indicating that the modification is successful.
Disabling SQL Explorer
- Log in to the management console.
- Click in the upper left corner and select a region and project.
- Click in the upper left corner of the page and choose .
- On the Instances page, click the name of the target instance to go to the Basic Information page.
- Choose Diagnostics and Optimization > SQL Diagnosis.
- On the SQL Explorer page, click
 . In the displayed dialog box, click OK.
 - Wait until the system displays a message indicating that SQL Explorer is disabled.
Creating a SQL Patch
- Log in to the management console.
- Click in the upper left corner and select a region and project.
- Click in the upper left corner of the page and choose .
- On the Instances page, click the name of the target instance to go to the Basic Information page.
- Choose Diagnostics and Optimization > SQL Diagnosis and click the SQL Explorer tab.
- On the Full SQL Statistics tab of the SQL Explorer page, click
 to expand the target row or click the Full Data by SQL Statement tab.
 - Locate a target SQL statement and click SQL Patch in the Operation column to go to the SQL Patch Details page.
- If no SQL patch is created, enter the patch name and content, and click OK to create one.
Figure 12 SQL patch

- If a SQL patch has been created, the SQL patch information is displayed.
Figure 13 Viewing SQL patch details

- Status: Click
 to enable or disable the SQL patch. If a SQL patch is disabled, the status is Disabled. If it is enabled, the status is Available.
 - To delete a SQL patch, click Delete.
- Status: Click
- If no SQL patch is created, enter the patch name and content, and click OK to create one.
Querying Table Definitions
- Log in to the management console.
- Click in the upper left corner and select a region and project.
- Click in the upper left corner of the page and choose .
- On the Instances page, click the name of the target instance to go to the Basic Information page.
- Choose Diagnostics and Optimization > SQL Diagnosis and click the SQL Explorer tab.
- On the Full SQL Statistics tab of the SQL Explorer page, click to expand the target row or click the Full Data by SQL Statement tab.
- In the Operation column of a specified record, click More and choose Table Definition. On the Table Definition page, view information in the Detected Tables area.
If no table is detected, click Add Table and enter a table name manually. If any detection result is incorrect, click Edit to modify, and then save the result.
- Click
 next to a table name to view its table definition.
Figure 14 Table Definition
next to a table name to view its table definition.
Figure 14 Table Definition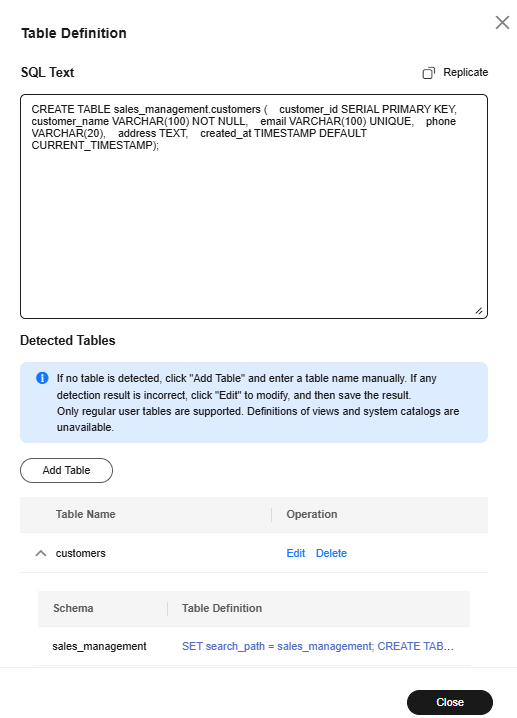
- Click the SQL statement in the table definition to view the definition details.
Figure 15 Table definition details

Feedback
Was this page helpful?
Provide feedbackThank you very much for your feedback. We will continue working to improve the documentation.See the reply and handling status in My Cloud VOC.
For any further questions, feel free to contact us through the chatbot.
Chatbot


