Viewing Top SQL Statements
Scenarios
GaussDB allows you to use workload diagnosis report (WDR) snapshots to query top SQL statements in a specified period and monitor SQL statement execution from multiple dimensions of resources.
Constraints
- The system retrieves top SQL data from a performance report generated based on two valid snapshots within your specified time range. Make sure there are no kernel reset events (such as node restarts, primary/standby switchovers, and DROP DATABASE operations) between the two snapshots.
- Top SQL data can be displayed only when at least two snapshots are available for comparison in the specified time range. By default, a snapshot is generated every hour.
Viewing Top SQL Statements
- Log in to the management console.
- Click
 in the upper left corner and select a region and project.
 - Click
 in the upper left corner of the page and choose .
 - On the Instances page, click the name of the target instance to go to the Basic Information page.
- Choose Diagnostics and Optimization > SQL Diagnosis.
- On the Top SQL tab, select one or more nodes, set the time range, apply combined filters using SQL text, normalized SQL ID, and other extended fields, and click Query to obtain the top SQL statement list.
- Data of a maximum of one day can be queried. You can select a time range as required and view data by node.
- Filter System Users: Toggle this option on if you want to ignore all SQL statements executed by system users. It is toggled on by default.
- You can select OR or AND to define how multiple SQL statements are combined during filtering. In the filter box, you may enter up to five SQL text snippets for combined filtering.
Table 1 Top SQL statement fields Field
Description
Normalized SQL ID
ID of the normalized form of a SQL statement
Node Name/ID
ID and name of the SQL execution node
Username
Name of the user who executed the SQL statement
SQL Text
Normalized SQL text
Invocation Frequency
The proportion of calls for a specific SQL statement relative to the total number of calls during a given time period
CPU Overhead Rate
The proportion of the CPU usage for a specific SQL statement relative to the total CPU usage during a given time period
I/O Overhead Rate
The proportion of the I/O usage for a specific SQL statement relative to the total I/O usage during a given time period
Invocation Times
The number of times that a specific SQL statement is executed in a given time period
Returned Tuples
The difference in the number of rows returned by the SELECT query of a specific SQL statement within a given time period
Read Tuples
The difference in the number of rows scanned sequentially by a specific SQL statement within a given time period
Avg. Execution Time
The average time taken to execute a specific SQL statement within a given time period Unit: ms
Total Execution Time
The total time taken to execute a specific SQL statement within a given time period
Unit: ms
CPU Overhead
The CPU time consumed by a specific SQL statement within a given time period
Unit: ms
I/O Overhead
The I/O overhead consumed by a specific SQL statement within a given time period
Unit: ms
Min. Execution Duration
The minimum execution time taken to execute a specific SQL statement within a given time period Unit: ms
Max. Execution Duration
The maximum execution time taken to execute a specific SQL statement within a given time period Unit: ms
SQL Hit Ratio
The ratio of rows returned (hit) to the rows scanned by a specific SQL statement within a given time period
Creating a SQL Patch
- Log in to the management console.
- Click
 in the upper left corner and select a region and project.
 - Click
 in the upper left corner of the page and choose .
 - On the Instances page, click the name of the target instance to go to the Basic Information page.
- Choose Diagnostics and Optimization > SQL Diagnosis.
- On the Top SQL tab, click SQL Patch in the Operation column to view SQL patch details.
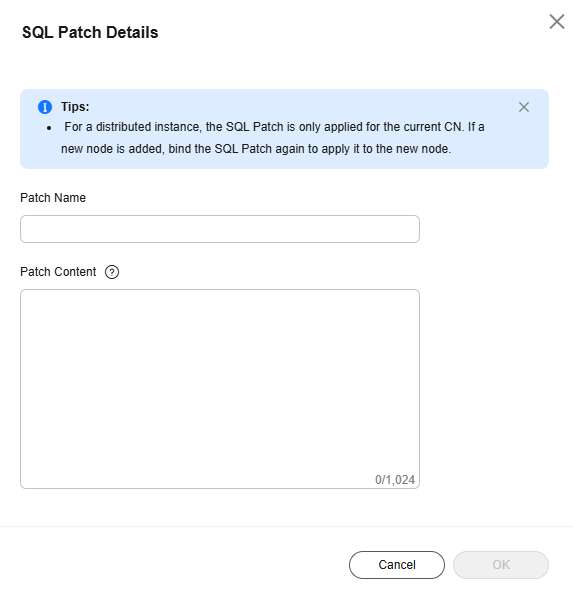
- If no SQL patch is created, enter the patch name and content, and click OK to create one.
Figure 1 SQL patch

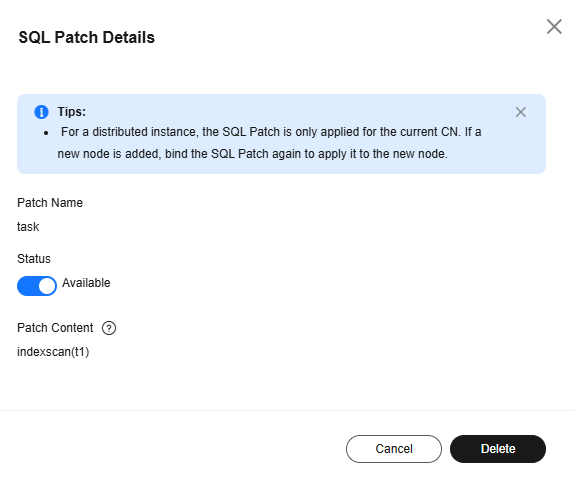
- If a SQL patch has been created, the SQL patch information is displayed.
Figure 2 Viewing SQL patch details

- Status: Click
 to enable or disable the SQL patch. If a SQL patch is disabled, the status is Disabled. If it is enabled, the status is Available.
 - To delete a SQL patch, click Delete.
- Status: Click
- If no SQL patch is created, enter the patch name and content, and click OK to create one.
Feedback
Was this page helpful?
Provide feedbackThank you very much for your feedback. We will continue working to improve the documentation.See the reply and handling status in My Cloud VOC.
For any further questions, feel free to contact us through the chatbot.
Chatbot


