
Viewing Slow SQL Statements
Scenarios
When your GaussDB instance encounters slow SQL queries, you can use the following features for optimization:
- SQL throttling: Control the access frequency or concurrency of abnormal SQL statements to ensure service availability.
- SQL plan: Bind or unbind specific execution plans to influence query behavior.
- Table definition query: Extract table names from SQL texts and retrieve corresponding table definitions based on the table name, schema name, and database name.
Constraints
- The database kernel does not permanently store slow SQL statement data. Slow SQL statement data for a DB instance will be cleared after any of the following operations is performed on the instance: rebooting or upgrading an instance, changing the instance specifications, starting or stopping a node, performing a primary/standby switchover, or changing the deployment model.
- The GaussDB instances must run on HCEOS.
- SQL plans are only available for centralized instances.
- Table definition query is available for instances whose DB engine version is V2.0-3.208.0 or later and kernel version is 503.1.0.SPC1200 or later. For details about how to query the version, see Checking the DB Engine and Kernel Engine Version of a GaussDB Instance.
- The maximum time span of slow SQL statement query is one day.
- SQL throttling cannot be performed for system-level users.
Viewing Slow SQL Statements
- Log in to the management console.
- Click
 in the upper left corner and select a region and project.
 - Click
 in the upper left corner of the page and choose .
 - On the Instances page, click the name of the target instance to go to the Basic Information page.
- Choose Diagnostics and Optimization > SQL Diagnosis.
- On the Slow SQL tab, select one or more nodes, set the time range, apply combined filters using SQL text, normalized SQL ID, and other extended fields, and click Query to obtain the slow SQL statement list.
- Data of a maximum of one day can be queried. You can select a time range as required and view data by node.
- Filter System Users: Toggle this option on if you want to ignore all SQL statements executed by system users. It is toggled on by default.
- You can select OR or AND to define how multiple SQL statements are combined during filtering. In the filter box, you may enter up to five SQL text snippets for combined filtering.
- Execution Longer Than: Set this parameter to a value greater than or equal to 1s to query the execution information of the SQL statements whose execution time is greater than or equal to the preset value. This threshold is controlled by the log_min_duration_statement parameter. The default minimum execution duration for determining a slow SQL statement is 3s. You can adjust the threshold on the Parameters page. For details about how to modify parameters, see Modifying Instance Parameters.
Table 1 Key slow SQL parameters Parameter
Description
Normalized SQL ID
Normalized ID of the slow SQL statement
Node Name/ID
Name and ID of the node where the SQL statement is executed
Username
Name of the user who executed the SQL statement
SQL Text
Normalized template of the slow SQL statement
SQL Plan
SQL execution plan
Slow SQL Queries
Number of times that the slow SQL statement is executed within a specified time range
Avg. Execution Duration (s)
Average execution time (in seconds) of a slow SQL template within a specified time range
Avg. CPU Duration (s)
CPU time, in seconds
Avg. I/O Duration (s)
I/O time, in seconds
Avg. Rows Returned
Number of rows in the result set returned by the SELECT statement
Avg. Rows Scanned
Number of rows scanned by the SQL statement
Buffer Hit Rate
Buffer cache efficiency
- Click View SQL in the Operation column to view the collected SQL text and the parsed original SQL text.
When track_stmt_parameter is enabled, variables in the collected SQL text are replaced with their actual values, so you can see the original SQL statement. However, for SQL text collected when track_stmt_parameter is disabled, the original values of the variables cannot be retrieved, and no content will be displayed here. For details about how to modify parameters, see Modifying Instance Parameters.
- Click SQL Throttling in the Operation column to apply concurrency control to the normalized SQL ID of the selected slow SQL statement. For details about how to create a SQL throttling task, see Configuring SQL Throttling Rules.
SQL Plan
- Log in to the management console.
- Click in the upper left corner and select a region and project.
- Click in the upper left corner of the page and choose .
- On the Instances page, click the name of the target instance to go to the Basic Information page.
- Choose Diagnostics and Optimization > SQL Diagnosis.
- On the Slow SQL tab, obtain the slow SQL statements.
- In the Operation column of a specified record, click More and choose SQL Plan to bind or unbind execution plans.
Table 2 Columns in the Bind or Unbind Execution Plans area Column Name
Description
Execution Plan
SQL execution plan.
Unique SQL ID
Unique ID of a SQL statement in the database.
Plan ID
Unique ID of the plan used by the current SQL statement.
Cost
Total plan cost.
Binding Status
Plan status. Plans in the Binding state can be unbound, and those in the Unbound state can be bound.
- Binding
- Unbound
- In the displayed dialog box, locate an execution plan, click
 in the Binding Status column of the Bind or Unbind Execution Plans area to bind or unbind the plan, and click OK.
Creating a SQL Patch
- Log in to the management console.
- Click in the upper left corner and select a region and project.
- Click in the upper left corner of the page and choose .
- On the Instances page, click the name of the target instance to go to the Basic Information page.
- Choose Diagnostics and Optimization > SQL Diagnosis.
- On the Slow SQL tab, obtain the slow SQL statements.
- In the Operation column of a specified record, click More and choose SQL Patch to view SQL patch details.
- If no SQL patch is created, enter the patch name and content, and click OK to create one.
Figure 1 SQL patch

- If a SQL patch has been created, the SQL patch information is displayed.
Figure 2 Viewing SQL patch details

- Status: Click
 to enable or disable the SQL patch. If a SQL patch is disabled, the status is Disabled. If it is enabled, the status is Available.
 - To delete a SQL patch, click Delete.
- Status: Click
- If no SQL patch is created, enter the patch name and content, and click OK to create one.
Querying Table Definitions
- Log in to the management console.
- Click in the upper left corner and select a region and project.
- Click in the upper left corner of the page and choose .
- On the Instances page, click the name of the target instance to go to the Basic Information page.
- Choose Diagnostics and Optimization > SQL Diagnosis.
- On the Slow SQL tab, select one or more nodes, specify the time range, and click Query to obtain the slow SQL statement list.
- In the Operation column of a specified record, click More and choose Table Definition. On the Table Definition page, view information in the Detected Tables area.
If no table is detected, click Add Table and enter a table name manually. If any detection result is incorrect, click Edit to modify, and then save the result.
- Click
 next to a table name to view its table definition.
Figure 3 Table Definition
next to a table name to view its table definition.
Figure 3 Table Definition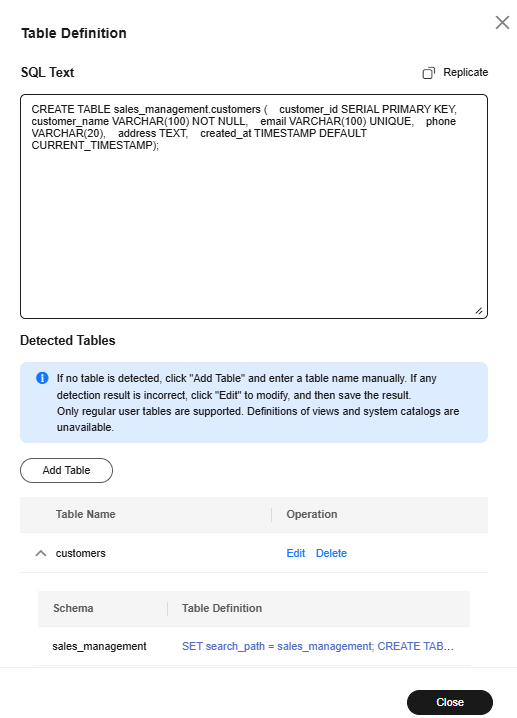
- Click the SQL statement in the table definition to view the definition details.
Figure 4 Table definition details

Feedback
Was this page helpful?
Provide feedbackThank you very much for your feedback. We will continue working to improve the documentation.See the reply and handling status in My Cloud VOC.
For any further questions, feel free to contact us through the chatbot.
Chatbot


