Viewing Slow Query Logs of a Standard HTAP Instance
Scenarios
Slow query logs record statements that exceed slowlog_query_duration_ms (5 seconds by default). You can view log details and statistics to identify slow statements, so you can optimize them.
Viewing Log Details
- Log in to the TaurusDB console.
- Click
 in the upper left corner and select a region and project.
 - On the Instances page, locate a TaurusDB instance and click its name to access the Basic Information page.
- In the navigation pane, choose HTAP Analysis.
- Click the name of an HTAP instance to access the Basic Information page.
- In the navigation pane, choose Logs.
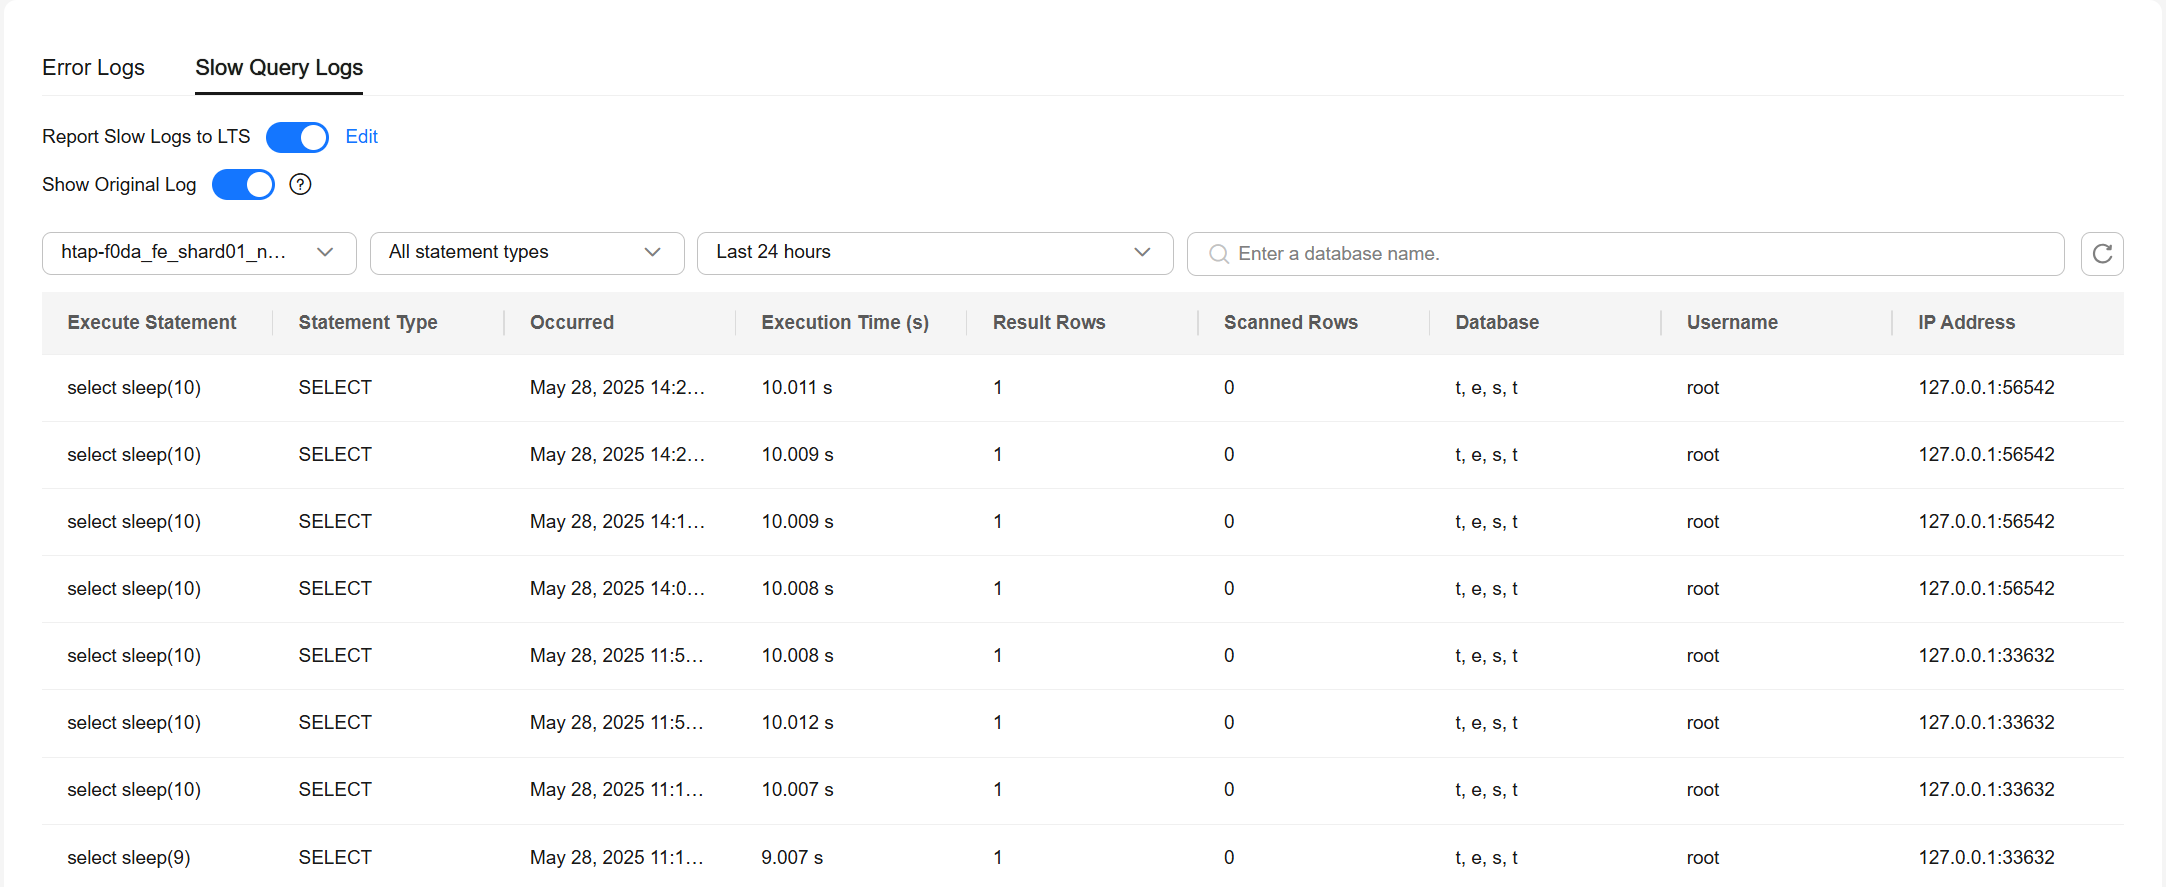
- On the Slow Query Logs tab, view the slow query log details.
- View slow query logs of different nodes and SQL statements in a given database.Figure 1 Viewing slow query logs

- Enabling Show Original Log
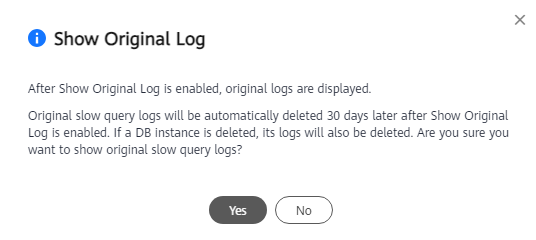
To show slow query logs in plaintext, click
 next to Show Original Log. In the displayed dialog box, click OK.
Original logs will be automatically deleted 30 days later. If the instance is deleted, its logs are also deleted.
Figure 2 Enabling Show Original Log
- Viewing slow query logs
View slow query logs of different nodes and SQL statements in a given database. You can view slow query logs generated in the last 15 minutes, last 30 minutes, last hour, last 24 hours, last 7 days, last 30 days, or a custom time range.
Supported SQL statements include SELECT, INSERT, UPDATE, DELETE, CREATE, ALTER, and DROP.
- Enabling Show Original Log
Reporting Slow Logs to LTS
After this function is enabled, logs record all requests sent to your instance and are stored in LTS. Once enabled, there is a delay of approximately 10 minutes before the changes are applied.
You will be billed for this function. For pricing details, see Billing.
- Log in to the TaurusDB console.
- Click
 in the upper left corner and select a region and project.
 - On the Instances page, locate a TaurusDB instance and click its name to access the Basic Information page.
- In the navigation pane, choose HTAP Analysis.
- Click the name of an HTAP instance to access the Basic Information page.
- In the navigation pane, choose Logs.
- On the Slow Query Logs tab, click
 next to Report Slow Logs to LTS.Figure 3 Reporting slow logs to LTS
- In the displayed dialog box, specify Log Group and Log Stream and click OK.Figure 4 Reporting slow logs to LTS

Feedback
Was this page helpful?
Provide feedbackThank you very much for your feedback. We will continue working to improve the documentation.See the reply and handling status in My Cloud VOC.
For any further questions, feel free to contact us through the chatbot.
Chatbot


