
DLI Ecosystem Interconnection
BI tools are powerful aids for data analysis, offering features such as data visualization, report generation, and dashboard creation.
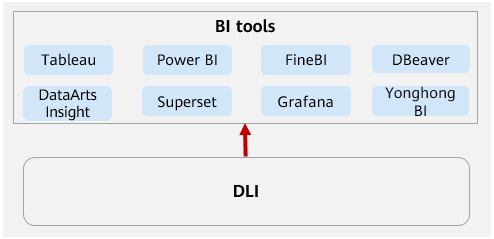
By analyzing and processing data, DLI provides BI tools with standard, effective, and high-quality data for statistical analysis.
By connecting to DLI, BI tools can more flexibly access and analyze data, helping businesses make data-driven decisions quickly.
This section describes the BI tools that can be connected to DLI.
|
BI Tool |
Description |
Helpful Link |
|---|---|---|
|
DBeaver |
DBeaver is a free, open source, and visual database management tool that you can use to manage various types of databases, including viewing the database structure, executing SQL queries and scripts, and browsing and exporting data. |
Configuring DBeaver to Connect to DLI for Data Query and Analysis |
|
Grafana |
Grafana is an open source tool that offers a variety of chart types to visualize data. It allows you to analyze and display data stored in DLI in a unified manner. |
Configuring Grafana to Connect to DLI for Data Query and Analysis |
|
Yonghong BI |
Yonghong BI is an enterprise-level data analysis tool that supports data visualization, report creation, data analysis, and decision-making. It helps businesses gain insights into their data and improve decision-making efficiency. |
Configuring Yonghong BI to Connect to DLI for Data Query and Analysis |
|
Superset |
Superset is an open source platform for data exploration and visualization. It allows for fast and intuitive exploration of data, as well as the creation of rich data visualizations and interactive dashboards. By connecting Superset to DLI, you can query and analyze data seamlessly. This streamlines the data access process, offers unified data management and analysis capabilities, and empowers you to uncover deeper insights from the data. |
Configuring Superset to Connect to DLI for Data Query and Analysis |
|
Power BI |
Power BI offers features such as data integration, warehousing, reporting, and visualization. It can transform complex data into visual charts and dashboards that are easy to understand and interact with, helping businesses make data-driven decisions. Connect Power BI to DLI for data query and analysis. This simplifies the data access process, provides unified data management and analysis capabilities, and gains in-depth data insights. |
Configuring Power BI to Connect to DLI for Data Query and Analysis |
|
FineBI |
FineBI is an intelligent, visual tool that focuses on data analysis and visualization. It can connect to various data sources and transform intricate data into user-friendly charts and dashboards, allowing for swift and efficient data analysis. |
Configuring FineBI to Connect to DLI Using Kyuubi for Data Query and Analysis |
|
Tableau |
Tableau is a data analysis and visualization tool that allows you to connect to various data sources through a drag-and-drop interface. It enables the creation of interactive and shareable data visualizations, which can turn data into actionable insights. |
Configuring Tableau to Connect to DLI Using Kyuubi for Data Query and Analysis |
Feedback
Was this page helpful?
Provide feedbackThank you very much for your feedback. We will continue working to improve the documentation.See the reply and handling status in My Cloud VOC.
For any further questions, feel free to contact us through the chatbot.
Chatbot


