Reporting Prometheus Monitoring Data to a Third-Party Monitoring Platform
Application Scenarios
The Cloud Native Cluster Monitoring add-on can report Prometheus metrics collected from clusters to a specified platform, for example, AOM or a third-party platform that supports Prometheus metrics. This section explains how to configure settings for Cloud Native Cluster Monitoring to send collected metrics to a third-party's Prometheus instance.
Step 1: Obtain the Data Reporting Address
Prometheus provides standard Remote Write APIs. You can enter the source address (Remote Write URL) in the Cloud Native Cluster Monitoring add-on for storing the locally collected monitoring data in a Prometheus instance remotely.
- If the Prometheus instance for receiving data is provided by a third-party vendor, view the Remote Write URL on the vendor's console.
- If the Prometheus instance for receiving data is an on-premises one, the Remote Write URL is https:// {prometheus_addr} /api/v1/write, where {prometheus_addr} indicates the IP address and port number for external access.
Step 2: Obtain the Authentication Mode
- For the third-party Prometheus instance, go to the vendor's console to view the token or account password used for authorized access.
- For the on-premises Prometheus instance, perform the following operations to obtain a token:
- If this Prometheus instance is deployed in a Kubernetes cluster, view the token in the corresponding container. If this Prometheus instance is deployed on a VM, skip this step.
kubectl exec -ti -n monitoring prometheus-server-0 -- sh
Replace the variables in the command as needed:
- monitoring: indicates the namespace where a Prometheus pod is in.
- prometheus-server-0: indicates the name of a Prometheus pod.
- Check the location of the configuration file.
ps -aux | grep prometheus
Information similar to the following is displayed:

- View and record the token information in prometheus.env.yaml.
cat /etc/prometheus/config_out/prometheus.env.yaml

- If this Prometheus instance is deployed in a Kubernetes cluster, view the token in the corresponding container. If this Prometheus instance is deployed on a VM, skip this step.
Step 3: Connect to a Third-Party Monitoring Platform
- Log in to the CCE console, click the name of a cluster with the Cloud Native Cluster Monitoring add-on installed to access the cluster console.
- In the navigation pane, choose Add-ons, locate the Cloud Native Cluster Monitoring add-on, and click Edit.
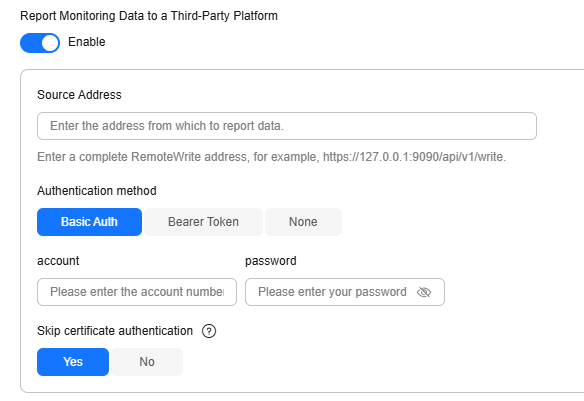
- Enable Report Monitoring Data to a Third-Party Platform so that the data collected by Cloud Native Cluster Monitoring can be reported to a third-party monitoring platform.
- Source Address: Remote Write URL obtained in step 1, for example, https://127.0.0.1:9090/api/v1/write.
- Authentication method: Select the authentication method supported by the third-party monitoring platform in step 2.
- Basic Auth: Enter the user name and password.
- Bearer Token: Enter the identity credential (token).

- After the modification is complete, click OK.
Step 4: Check the Data Sending and Receiving Statuses
After the preceding configuration is complete, log in to the Prometheus console supported by the third-party platform and view the Prometheus metrics with remote write on the Graph page.

Feedback
Was this page helpful?
Provide feedbackThank you very much for your feedback. We will continue working to improve the documentation.See the reply and handling status in My Cloud VOC.
For any further questions, feel free to contact us through the chatbot.
Chatbot


