

Scaling Based on Load Balancer Monitoring Metrics
Background
By default, Kubernetes scales a workload based on resource usage metrics such as CPU and memory usage. However, this cannot reflect the real-time resource usage when traffic bursts arrive because the collected CPU and memory usage data lags behind the actual load balancer traffic metrics. For some services, such as flash sale and social media, that require fast auto scaling, scaling based on this rule may not be performed in a timely manner and cannot meet these services' actual needs. In this case, auto scaling based on load balancer QPS can respond to service requirements more timely.
Solution
This section describes an auto scaling solution based on load balancer monitoring metrics. Compared with CPU/memory usage-based auto scaling, auto scaling based on load balancer QPS is more targeted and timely.
The key to this solution is to obtain the load balancer metric data and report the data to Prometheus, have the data in Prometheus converted to the metric data that can be identified by an HPA, and then perform auto scaling based on the converted data.
The implementation scheme is as follows:
- Develop a Prometheus exporter to obtain load balancer metric data, convert the data into the format required by Prometheus, and report it to Prometheus. This section uses cloudeye-exporter as an example.
- Convert the Prometheus data into the Kubernetes metric API for the HPA controller to use.
- Configure an HPA rule to use load balancer monitoring data as auto scaling metrics.


Other metrics can be collected in a similar way.
Prerequisites
- You are familiar with Prometheus.
- You have installed the Cloud Native Cluster Monitoring add-on (kube-prometheus-stack) of version 3.10.1 or later in the cluster.
Local Data Storage must be enabled in Data Storage Configuration.
Building an Exporter Image
This section uses cloudeye-exporter to monitor load balancer metrics. To develop an exporter, see Appendix: Developing an Exporter.
- Log in to a VM that can access the Internet and has Docker installed and write a Dockerfile.
vi Dockerfile
The content is as follows:RUN apt-get update \ && apt-get install -y wget ca-certificates \ && update-ca-certificates \ && wget https://github.com/huaweicloud/cloudeye-exporter/releases/download/v2.0.16/cloudeye-exporter-v2.0.16.tar.gz \ && tar -xzvf cloudeye-exporter-v2.0.16.tar.gz CMD ["./cloudeye-exporter -config=/tmp/clouds.yml"]cloudeye-exporter of v2.0.16 is used as an example. For more versions, see Releases.
- Build an image. The image name is cloudeye-exporter and the image tag is 2.0.16.
docker build --network host . -t cloudeye-exporter:2.0.16
- Push the image to SWR.
- (Optional) Log in to the SWR console, choose Organizations in the navigation pane, and click Create Organization in the upper right corner.
Skip this step if you already have an organization.
- In the navigation pane, choose My Images and then click Upload Through Client. In the dialog box displayed, click Generate Login Command and click
 to copy the command.
 - Run the copied login command on the node. If the login is successful, the message "Login Succeeded" is displayed.
- Tag the cloudeye-exporter image.
docker tag {Image name 1:Tag 1}/{Image repository address}/{Organization name}/{Image name 2:Tag 2}
- {Image name 1:Tag 1}: name and tag of the local image to be pushed
- {Image repository address}: The domain name at the end of the login command in 3.b is the image repository address, which can be obtained on the SWR console.
- {Organization name}: name of the organization created in 3.a
- {Image name 2:Tag 2}: target image name and tag to be displayed on the SWR console
The following is an example:
docker tag cloudeye-exporter:2.0.16 swr.ap-southeast-3.myhuaweicloud.com/container/cloudeye-exporter:2.0.16
- Push the image to the image repository.
docker push {Image repository address}/{Organization name}/{Image name 2:Tag 2}
The following is an example:
docker push swr.ap-southeast-3.myhuaweicloud.com/container/cloudeye-exporter:2.0.16
The following information will be returned upon a successful push:
...
030***: Pushed
2.0.16: digest: sha256:eb7e3bbd*** size: **
To view the pushed image, go to the SWR console and refresh the My Images page.
- (Optional) Log in to the SWR console, choose Organizations in the navigation pane, and click Create Organization in the upper right corner.
Deploying an Exporter
If you add Prometheus annotations to the resources (the default path is /metrics), Prometheus can dynamically monitor these resources. cloudeye-exporter is used as an example.
Typical annotations in Prometheus include:
- prometheus.io/scrape: Setting it to true means the resource will be the monitoring target.
- prometheus.io/path: URL from which the data is collected. The default value is /metrics.
- prometheus.io/port: port number of the endpoint to collect data from.
- prometheus.io/scheme: defaults to http. If HTTPS is configured for security purposes, change the value to https.
- Use kubectl to access the cluster.
- Create a secret, which will be used by cloudeye-exporter for authentication.
- Create a clouds.yml file with the following content:
    global:
      prefix: "huaweicloud"
      scrape_batch_size: 300
    auth:
      auth_url: "https://iam.ap-southeast-3.myhuaweicloud.com/v3"
      project_name: "ap-southeast-3"
      access_key: "********"
      secret_key: "***********"
      region: "ap-southeast-3"
Where:
- auth_url: an IAM endpoint, which can be obtained from Regions and Endpoints.
- project_name: a project name, which can be obtained in the Projects area on the My Credential page
- access_key and secret_key: You can obtain them from Access Keys.
- region: a region name, which must correspond with the project in project_name
- Obtain the Base64-encrypted string of this file.
cat clouds.yml | base64 -w0 ;echo
Information similar to the following is displayed:
ICAga*****
- Create the clouds-secret.yaml file with the following content:
apiVersion: v1 kind: Secret data: clouds.yml: ICAga***** # Replace it with the Base64-encrypted string. metadata: annotations: description: '' name: 'clouds.yml' namespace: default #Namespace where the secret is in, which must be the same as the Deployment's namespace. labels: {} type: Opaque - Create the secret.
kubectl apply -f clouds-secret.yaml
- Create a clouds.yml file with the following content:
- Create a cloudeye-exporter-deployment.yaml file with the following content:
kind: Deployment
apiVersion: apps/v1
metadata:
  name: cloudeye-exporter
  namespace: default
spec:
  replicas: 1
  selector:
    matchLabels:
      app: cloudeye-exporter
      version: v1
  template:
    metadata:
      labels:
        app: cloudeye-exporter
        version: v1
    spec:
      volumes:
        - name: vol-166055064743016314
          secret:
            secretName: clouds.yml
            defaultMode: 420
      containers:
        - name: container-1
          image: swr.ap-southeast-3.myhuaweicloud.com/container/cloudeye-exporter:2.0.16  # The exporter image address built above
          command:
            - ./cloudeye-exporter  # Startup command for building the cloudeye-exporter image
            - '-config=/tmp/clouds.yml'
          resources: {}
          volumeMounts:
            - name: vol-166055064743016314
              readOnly: true
              mountPath: /tmp
          terminationMessagePath: /dev/termination-log
          terminationMessagePolicy: File
          imagePullPolicy: IfNotPresent
      restartPolicy: Always
      terminationGracePeriodSeconds: 30
      dnsPolicy: ClusterFirst
      securityContext: {}
      imagePullSecrets:
        - name: default-secret
      schedulerName: default-scheduler
  strategy:
    type: RollingUpdate
    rollingUpdate:
      maxUnavailable: 25%
      maxSurge: 25%
  revisionHistoryLimit: 10
  progressDeadlineSeconds: 600
Create the workload.
kubectl apply -f cloudeye-exporter-deployment.yaml
- Create the cloudeye-exporter-service.yaml file.
apiVersion: v1
kind: Service
metadata:
  name: cloudeye-exporter
  namespace: default
  labels:
    app: cloudeye-exporter
    version: v1
  annotations:
    prometheus.io/port: '8087'      #Port number of the endpoint to collect data from.
    prometheus.io/scrape: 'true'    #If it is set to true, the resource will be the monitoring target.
    prometheus.io/path: "/metrics"  #URL from which the data is collected. The default value is /metrics.
    prometheus.io/scheme: "http"    #The default value is http. If HTTPS is needed for security purposes, change it to https.
spec:
  ports:
    - name: cce-service-0
      protocol: TCP
      port: 8087
      targetPort: 8087
  selector:
    app: cloudeye-exporter
    version: v1
  type: ClusterIP
Create the preceding Service.
kubectl apply -f cloudeye-exporter-service.yaml
Interconnecting with Prometheus
After collecting monitoring data, Prometheus converts the data into the Kubernetes metric API for the HPA controller to perform auto scaling.
In this example, the load balancer metrics associated with the workload are monitored. Therefore, the target workload must use a LoadBalancer Service or ingress.
- View the Service type of the workload and obtain the load balancer listener ID.
- On the CCE cluster console, choose Services and Ingresses. On the Services or Ingresses tab, view the LoadBalancer Service or ingress and click the load balancer name to access its details page.
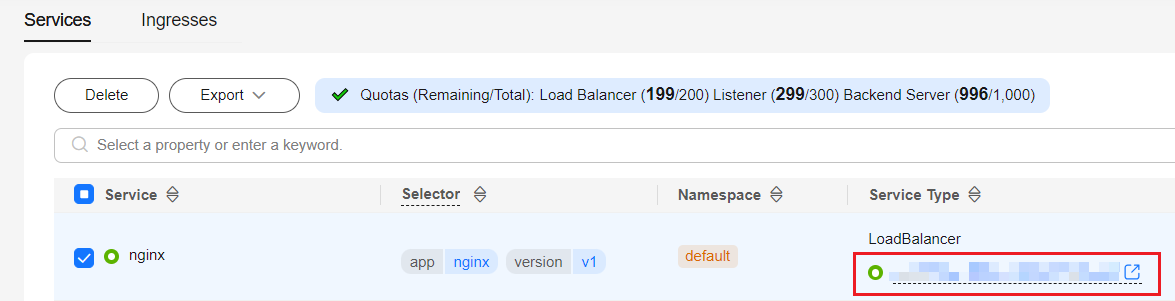
- On the Listeners tab, view the listener of the workload and copy the listener ID.
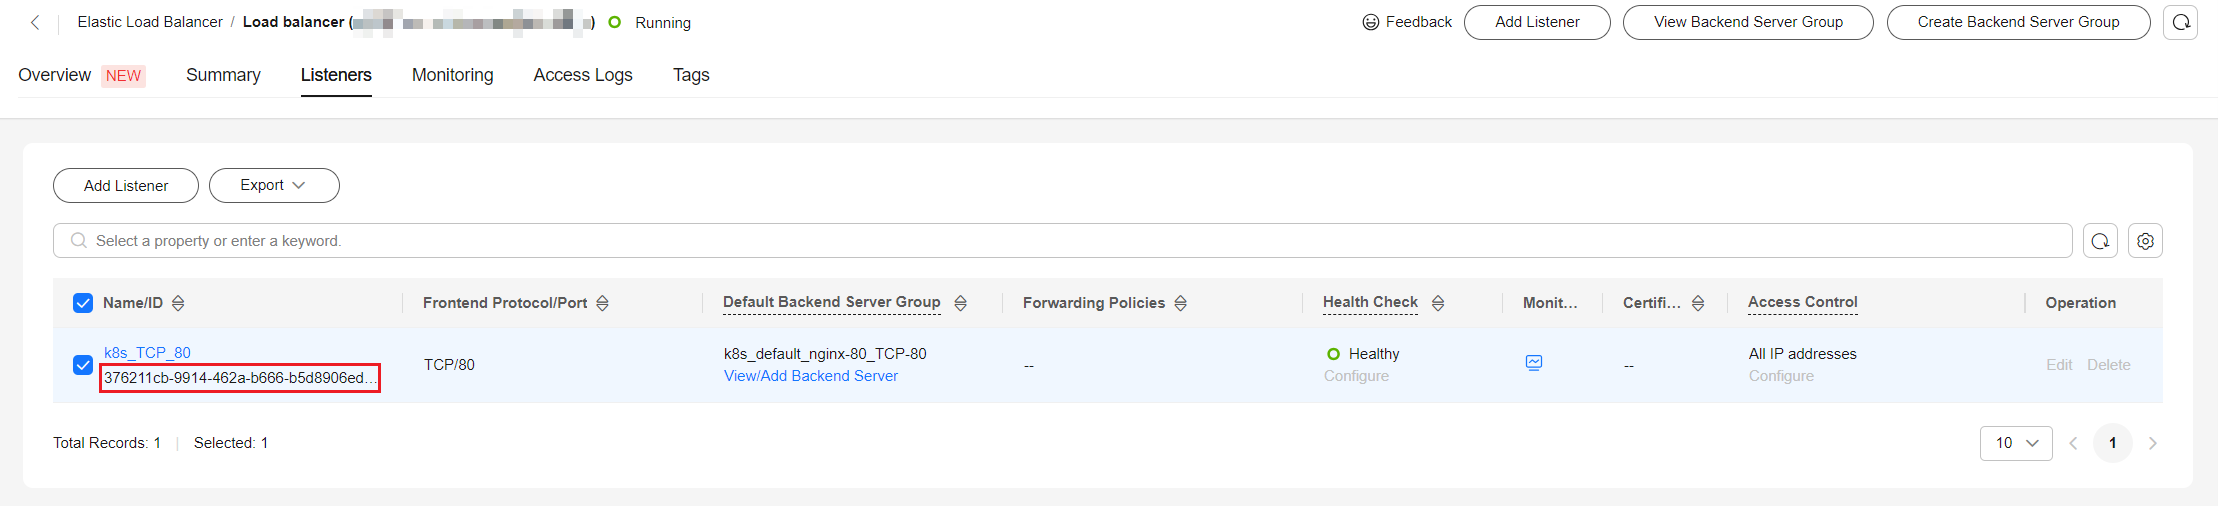
- On the CCE cluster console, choose Services and Ingresses. On the Services or Ingresses tab, view the LoadBalancer Service or ingress and click the load balancer name to access its details page.
- Use kubectl to access the cluster and add Prometheus configurations. In this example, load balancer metrics are collected. For details about advanced usage, see Configuration.
- Create a prometheus-additional.yaml file, add the content below to the file, and save the file.
- job_name: elb_metric params: services: ['SYS.ELB'] kubernetes_sd_configs: - role: endpoints relabel_configs: - action: keep regex: '8087' source_labels: - __meta_kubernetes_service_annotation_prometheus_io_port - action: replace regex: ([^:]+)(?::\d+)?;(\d+) replacement: $1:$2 source_labels: - __address__ - __meta_kubernetes_service_annotation_prometheus_io_port target_label: __address__ - action: labelmap regex: __meta_kubernetes_service_label_(.+) - action: replace source_labels: - __meta_kubernetes_namespace target_label: kubernetes_namespace - action: replace source_labels: - __meta_kubernetes_service_name target_label: kubernetes_service - Create a secret named additional-scrape-configs using this file.
kubectl create secret generic additional-scrape-configs --from-file prometheus-additional.yaml -n monitoring --dry-run=client -o yaml | kubectl apply -f -
- Edit persistent-user-config to enable AdditionalScrapeConfigs.
kubectl edit configmap persistent-user-config -n monitoring
Add --common.prom.default-additional-scrape-configs-key=prometheus-additional.yaml under operatorConfigOverride to enable AdditionalScrapeConfigs. An example is as follows:
... data: lightweight-user-config.yaml: | customSettings: additionalScrapeConfigs: [] agentExtraArgs: [] metricsDeprecated: globalDeprecateMetrics: [] nodeExporterConfigOverride: [] operatorConfigOverride: - --common.prom.default-additional-scrape-configs-key=prometheus-additional.yaml ... - Go to Prometheus and check whether custom metrics have been collected.
- Create a prometheus-additional.yaml file, add the content below to the file, and save the file.
- Modify the user-adapter-config configuration item.
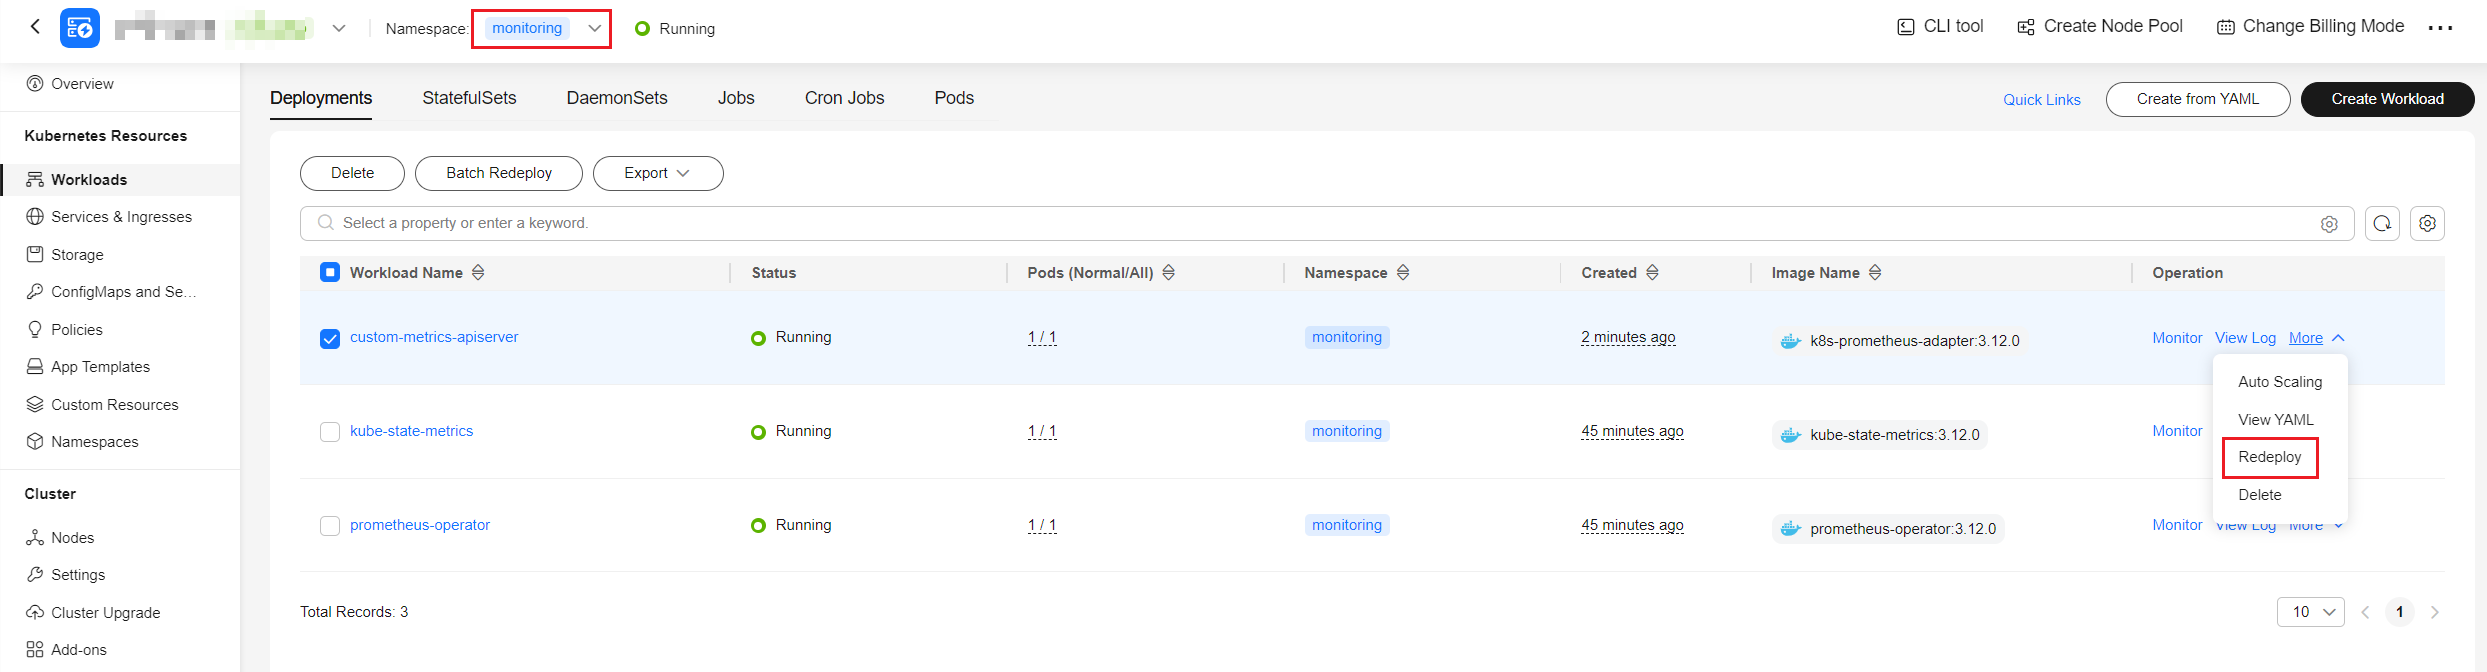
kubectl edit configmap user-adapter-config -nmonitoringAdd the content below to the rules field, replace lbaas_listener_id with the listener ID obtained in 1, and save the file.apiVersion: v1 data: config.yaml: |- rules: - metricsQuery: sum(<<.Series>>{<<.LabelMatchers>>,lbaas_listener_id="*****"}) by (<<.GroupBy>>) resources: overrides: kubernetes_namespace: resource: namespace kubernetes_service: resource: service name: matches: huaweicloud_sys_elb_(.*) as: "elb01_${1}" seriesQuery: '{lbaas_listener_id="*****"}' ... - Redeploy the custom-metrics-apiserver workload in the monitoring namespace.
Creating an HPA Policy
After the data reported by the exporter to Prometheus is converted into the Kubernetes metric API by using the Prometheus adapter, you can create an HPA policy for auto scaling.
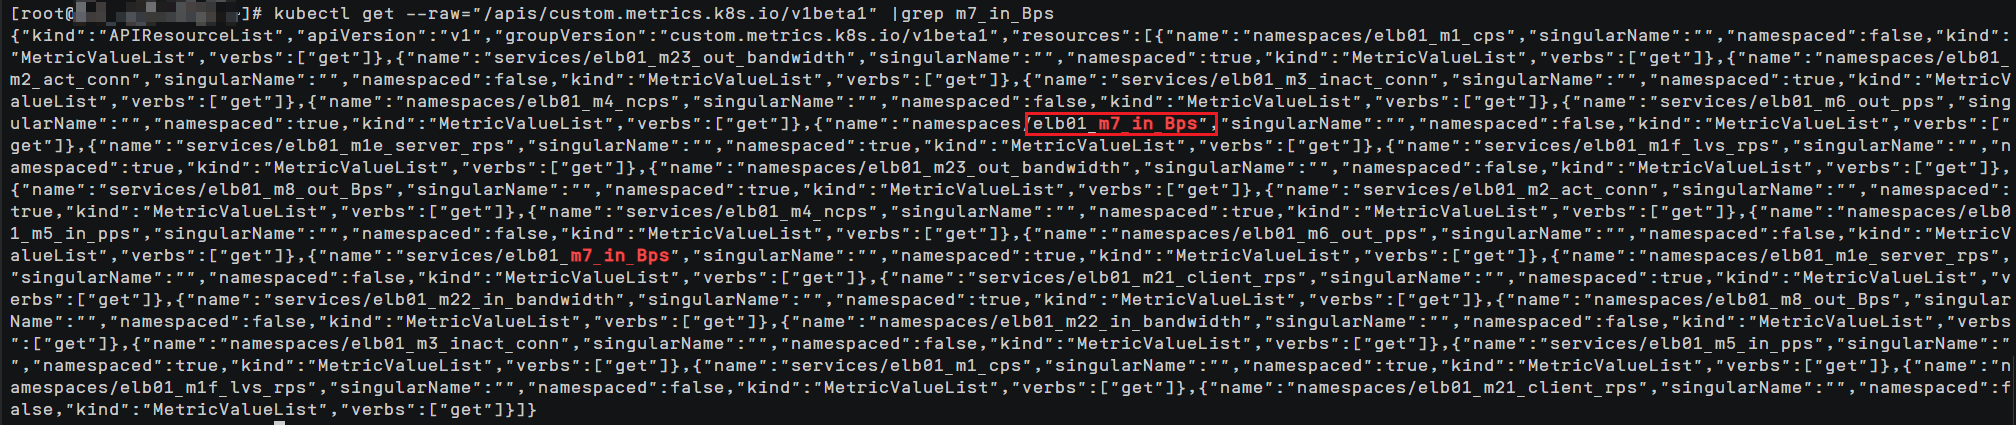
- Obtain the name of a custom metric in the cluster. m7_in_Bps (inbound traffic rate) is used as an example. For details about other load balancer metrics, see Load Balancer Listener Metrics.
kubectl get --raw="/apis/custom.metrics.k8s.io/v1beta1" |grep m7_in_Bps
Information similar to that in the figure below is displayed.
- Create an HPA policy. The inbound traffic of the load balancer is used to trigger scale-outs. When the value of m7_in_Bps (inbound traffic rate) exceeds 1,000, the nginx Deployment will be scaled.
apiVersion: autoscaling/v2
kind: HorizontalPodAutoscaler
metadata:
  name: nginx
  namespace: default
spec:
  scaleTargetRef:
    apiVersion: apps/v1
    kind: Deployment
    name: nginx
  minReplicas: 1
  maxReplicas: 10
  metrics:
    - type: Object
      object:
        metric:
          name: elb01_m7_in_Bps  # Name of the custom monitoring metric obtained in the previous step
        describedObject:
          apiVersion: v1
          kind: Service
          name: cloudeye-exporter
        target:
          type: Value
          value: 1000
Figure 2 Created HPA policy

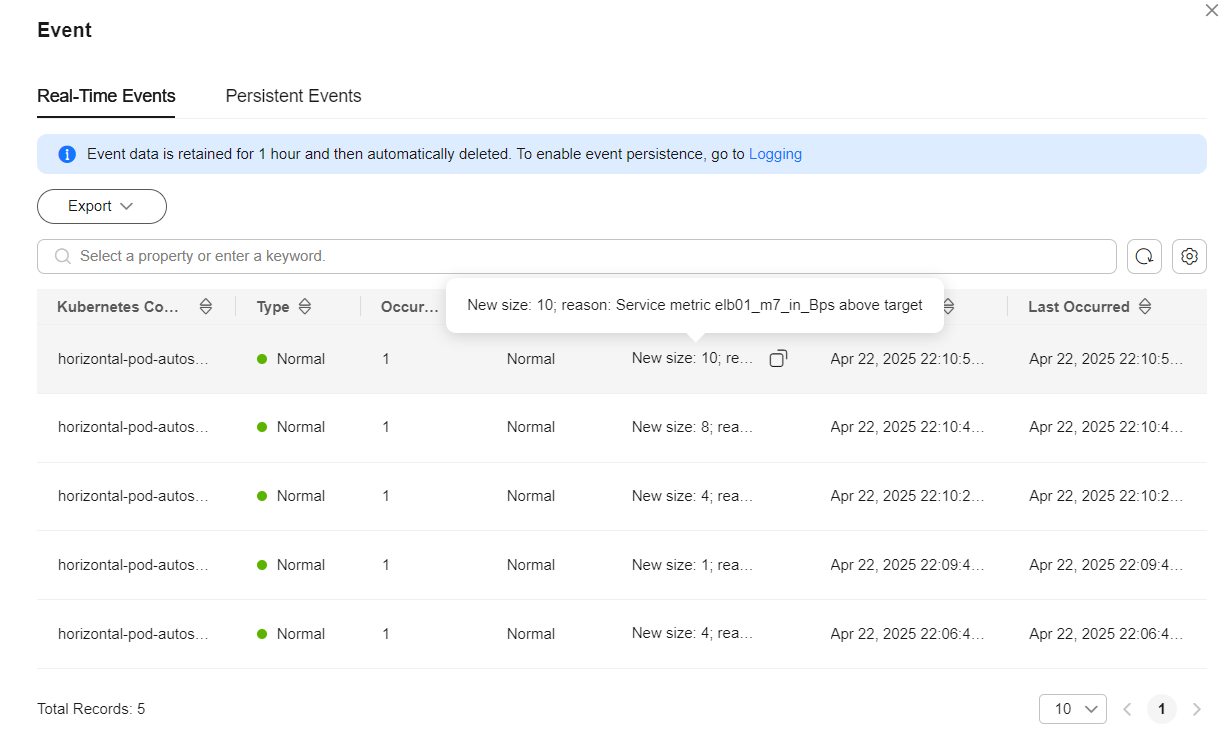
- After the HPA policy is created, perform a pressure test on the workload (accessing the pods through the load balancer). Then, the HPA controller determines whether scaling is required based on the configured value. In the Events dialog box, obtain scaling records in the Kubernetes Event column.Figure 3 Scaling events
Load Balancer Listener Metrics
The table below lists the load balancer listener metrics that can be collected using the method described in this section.
| Metric | Name | Unit | Description |
|---|---|---|---|
| m1_cps | Concurrent Connections | Count | The number of concurrent connections processed by a load balancer |
| m1e_server_rps | Reset Packets from Backend Servers | Count/Second | The number of reset packets sent from backend servers to clients. These packets are generated by the backend servers and then forwarded by the load balancer. |
| m1f_lvs_rps | Reset Packets from Load Balancers | Count/Second | The number of reset packets sent from a load balancer |
| m21_client_rps | Reset Packets from Clients | Count/Second | The number of reset packets sent from clients to the backend servers. These packets are generated by the clients and then forwarded by the load balancer. |
| m22_in_bandwidth | Inbound Bandwidth | bit/s | Inbound bandwidth of a load balancer |
| m23_out_bandwidth | Outbound Bandwidth | bit/s | Outbound bandwidth of a load balancer |
| m2_act_conn | Active Connections | Count | The number of current active connections |
| m3_inact_conn | Inactive Connections | Count | The number of current inactive connections |
| m4_ncps | New Connections | Count | The number of current new connections |
| m5_in_pps | Incoming Packets | Count | The number of packets sent to a load balancer |
| m6_out_pps | Outgoing Packets | Count | The number of packets sent from a load balancer |
| m7_in_Bps | Inbound Rate | byte/s | The number of incoming bytes per second on a load balancer |
| m8_out_Bps | Outbound Rate | byte/s | The number of outgoing bytes per second on a load balancer |
Appendix: Developing an Exporter
Prometheus periodically calls the /metrics API of the exporter to obtain metric data. Applications only need to report monitoring data through /metrics. You can select a Prometheus client in a desired language and integrate it into applications to implement the /metrics API. For details about the clients, see Client libraries. For details about how to write an exporter, see Writing exporters.
The monitoring data must be in the format that Prometheus supports. Each data record provides the load balancer ID, listener ID, namespace where the Service is located, Service name, and Service UID as labels.

To obtain the data, perform the following operations:
- Obtain all Services.
The annotations field in the returned information contains the load balancers associated with the Services.
- kubernetes.io/elb.id
- kubernetes.io/elb.class
- Use APIs in Querying Listeners to get the listener ID based on the load balancer ID obtained in the previous step.
- Obtain the load balancer monitoring data.
The load balancer monitoring data is obtained using the CES APIs in Querying Monitoring Data of Multiple Metrics . For details about load balancer monitoring metrics, see Monitoring Metrics. The following shows some examples:
- m1_cps: the number of concurrent connections
- m5_in_pps: the number of incoming data packets
- m6_out_pps: the number of outgoing data packets
- m7_in_Bps: incoming rate
- m8_out_Bps: outgoing rate
- Aggregate data in the format that Prometheus supports and expose the data through the /metrics API.
The Prometheus client can easily call the /metrics API. For details, see Client libraries. For details about how to write an exporter, see Writing exporters.
What is your overall rating for this page?
Thank you very much for your feedback. We will continue working to improve the documentation.See the reply and handling status in My Cloud VOC.
For any further questions, feel free to contact us through the chatbot.
Chatbot


