
Viewing Slow Query Logs
Scenarios
Slow Query Logs displays a chart of SQL statements that are taking too long to execute and allows you to sort slow SQL statements by multiple dimensions, such as by user, host, or SQL template. It helps you quickly identify bottlenecks and improve instance performance.
Constraints
- If you did not subscribe to Intelligent O&M, you can only view the data of the last hour. The data will be automatically deleted when it expires. You are advised to subscribe to Intelligent O&M. This will allow data to be stored for up to 30 days. For details, see Subscribing to Intelligent O&M.
- After Collect Slow Query Logs is enabled, SQL text will be stored in OBS.
- Incorrectly optimizing slow queries may cause service exceptions. Exercise caution when performing this operation.
Slow Query Log Configurations
Subscribing to Intelligent O&M
- Log in to the TaurusDB console.
- Click
 in the upper left corner and select a region.
 - On the Instances page, click the target instance name.
- In the navigation pane, choose SQL Analysis and Tuning under DBA Assistant.
- Click the Slow Query Logs tab.
- Click Subscribe. In the displayed dialog box, you can learn about Intelligent O&M functions and pricing.
Your instance will get 5 GB of storage for free after subscribing to Intelligent O&M.
Figure 1 Subscribing to Intelligent O&M
- Select "I have read and understand the billing rules." and click Subscribe.
Configuring Slow Query Log Collection
Click Log Settings in the upper right corner. In the displayed dialog box, enable Collect Slow Query Logs and click OK. SQL statement logs can then be stored for analysis.
If you do not need to collect slow query logs later, you can disable Collect Slow Query Logs. If Collect Slow Query Logs is disabled, DAS will no longer collect new SQL statements and removes collected SQL data.

Configuring Slow Query Log Storage
- Intelligent O&M subscribed: Click Log Settings in the upper right corner to set slow query log retention days.
- Slow Query Log Period: The default value is 7. The value ranges from 1 to 30. After the period expires, the logs are automatically deleted.
- SQL Insights Retention Period: The default value is 7. The value ranges from 1 to 180.
- Log Size: Each paid instance can use 5 GB of storage for slow query logs for free. Any storage used in excess of 5 GB will be billed on a pay-per-use basis.
Figure 2 Log storage and archiving
- Intelligent O&M not subscribed:
- Slow Query Log Period: The default value is 1 hour and cannot be changed. After the period expires, the logs are automatically deleted.
- SQL Insights Retention Period: 1 hour
Figure 3 Log storage and archiving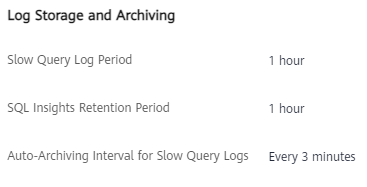
Viewing Slow Query Logs
- Log in to the TaurusDB console.
- Click in the upper left corner and select a region.
- On the Instances page, click the target instance name.
- In the navigation pane, choose SQL Analysis and Tuning under DBA Assistant.
- Click the Slow Query Logs tab.
- Select a time range, and view slow queries over time by instance or node.
You can view slow query logs in the last 1 hour, last 3 hours, last 6 hours, last 12 hours, or a custom time period.
- Above the chart, switch to another instance or node to view its slow queries over time.
Move the cursor to a point in time of the chart to view the number of slow query logs and CPU usage at the point in time.
Figure 4 Viewing slow queries over time
- Log in to the TaurusDB console.
- Click in the upper left corner and select a region.
- On the Instances page, click the target instance name.
- In the navigation pane, choose SQL Analysis and Tuning under DBA Assistant.
- Click the Slow Query Logs tab.
- Select an instance, node, and time range, and view slow query log details. The details include the SQL statements, execution start time, databases, clients, users, execution durations, lock wait durations, and scanned and returned rows.
You can view slow query logs in the last 1 hour, last 3 hours, last 6 hours, last 12 hours, or a custom time period.
Figure 5 Viewing slow query log details
- Export slow query log details.
- Click Export.
- In the displayed dialog box, select Quick export or Export all for Export Mode. Figure 6 Exporting slow query log details

- Quick export: Log details are exported to your local PC. Only the first 1,000 records can be exported.
- Export all: Select an OBS bucket and a directory to export log details to the OBS bucket. Up to 100,000 records can be exported.
If no OBS bucket is available, click Create. In the displayed dialog box, enter an OBS bucket name, and click OK.
Creating an OBS bucket is free, but you will be billed for storing files in the bucket. For pricing details, see OBS Pricing Details.
A bucket name:- Cannot be the same as that of any existing bucket.
- Can contain 3 to 63 characters. Only lowercase letters, digits, hyphens (-), and periods (.) are allowed.
- Cannot start or end with a period (.) or hyphen (-), and cannot contain two consecutive periods (.) or contain a period (.) and a hyphen (-) adjacent to each other.
- Cannot be an IP address.
- If the bucket name contains a period (.), certificate-based verification is required when you use the name to access an OBS bucket or object.
- Click OK.
- After the slow query log details are exported, click View All Export Records. In the displayed dialog box, click Download in the Operation column. After the download is complete, view the slow query log details in the ZIP package.
- To add a SQL throttling rule, locate a record and click SQL Throttling in the Operation column. In the displayed dialog box, specify SQL Type, Keyword, and Max. Concurrent Requests, and click OK. For details, see Configuring SQL Throttling.
- To view SQL diagnosis results, locate a record and click Diagnose in the Operation column. In the displayed dialog box, confirm the slow SQL statement to be diagnosed and click OK. In the Diagnosis Details area, you can see the SQL diagnosis results. Figure 7 Diagnosing a SQL statement
 Figure 8 Viewing diagnosis details
- Export slow query log details.
- Log in to the TaurusDB console.
- Click in the upper left corner and select a region.
- On the Instances page, click the target instance name.
- In the navigation pane, choose SQL Analysis and Tuning under DBA Assistant.
- Click the Slow Query Logs tab.
- Select an instance, node, and time range. In the Top 5 Slow Query Logs area, view the top 5 slow SQL statements by user or client IP address.
You can view slow query logs in the last 1 hour, last 3 hours, last 12 hours, or a custom time period.
Figure 9 Viewing top 5 slow query logs
- Log in to the TaurusDB console.
- Click in the upper left corner and select a region.
- On the Instances page, click the target instance name.
- In the navigation pane, choose SQL Analysis and Tuning under DBA Assistant.
- Click the Slow Query Logs tab.
- Select an instance, node, and time range, and view the template statistics. Figure 10 Viewing template statistics

- Export template statistics.
- Click Export.
- In the displayed dialog box, select Quick export or Export all for Export Mode. Figure 11 Exporting slow query log details

- Quick export: Logs will be exported to your local PC.
- Export all: Select an OBS bucket and a directory to export log details to the OBS bucket. Up to 100,000 records can be exported.
If no OBS bucket is available, click Create. In the displayed dialog box, enter an OBS bucket name, and click OK.
Creating an OBS bucket is free, but you will be billed for storing files in the bucket. For pricing details, see OBS Pricing Details.
A bucket name must meet the following requirements:- It cannot be the same as that of any existing bucket.
- It can contain 3 to 63 characters. Only lowercase letters, digits, hyphens (-), and periods (.) are allowed.
- It cannot start or end with a period (.) or hyphen (-), and cannot contain two consecutive periods (.) or contain a period (.) and a hyphen (-) adjacent to each other.
- It cannot be an IP address.
- If the bucket name contains a period (.), certificate-based verification is required when you use the name to access an OBS bucket or object.
- Click OK.
- After the details are exported, click View All Export Records. In the displayed dialog box, click Download in the Operation column. After the download is complete, view the slow query log details in the ZIP package.
- Click View Sample in the Operation to view the sample of a SQL template.
- To view SQL diagnosis results, locate a record and click Diagnose in the Operation column. In the displayed dialog box, confirm the slow SQL statement to be diagnosed and click OK. In the Diagnosis Details area, you can see the SQL diagnosis results. Figure 12 Diagnosing a SQL statement
 Figure 13 Viewing diagnosis details
- Export template statistics.
Feedback
Was this page helpful?
Provide feedbackThank you very much for your feedback. We will continue working to improve the documentation.See the reply and handling status in My Cloud VOC.
For any further questions, feel free to contact us through the chatbot.
Chatbot


