Message Trace
Message trace can be used to quickly locate and analyze faults that occur during device authentication, command delivery, data reporting, and data forwarding. The platform supports message trace for NB-IoT and MQTT devices. You can trace messages for up to 10 devices simultaneously.
Procedure
- Access the IoTDA service page and click Access Console. Click the target instance card.
- In the navigation pane, choose .
- Search for the device to trace and click View to access its details page.
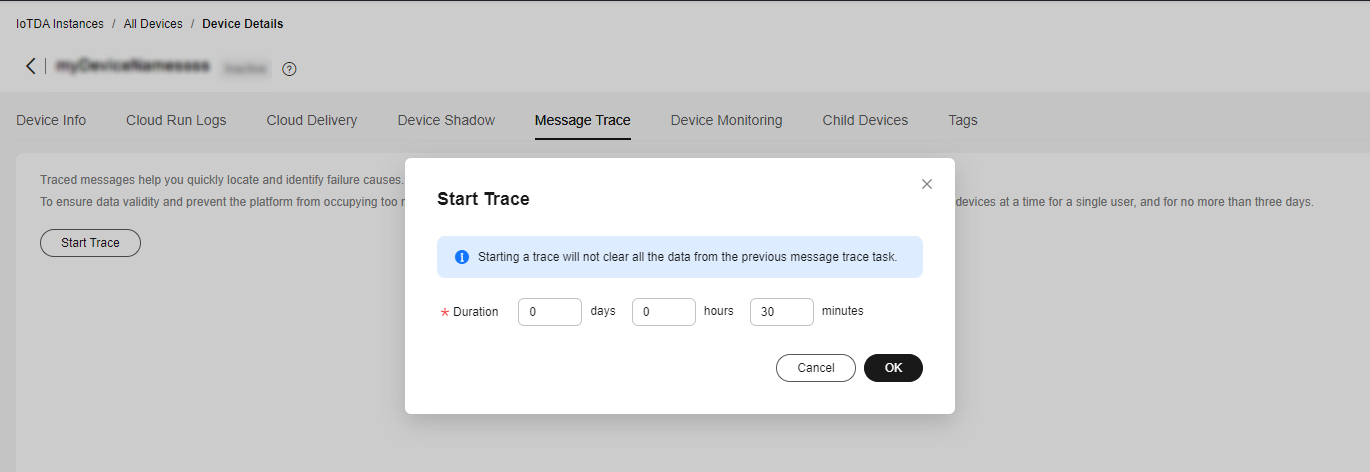
- On the Message Trace tab page, click Start Trace, and set the message trace duration, which indicates the duration from the time when message trace starts to the time when message trace ends. You can also click Edit Configuration to modify the message trace configuration. The message trace duration is subject to the new one.
Figure 1 Message tracing - Starting message tracing

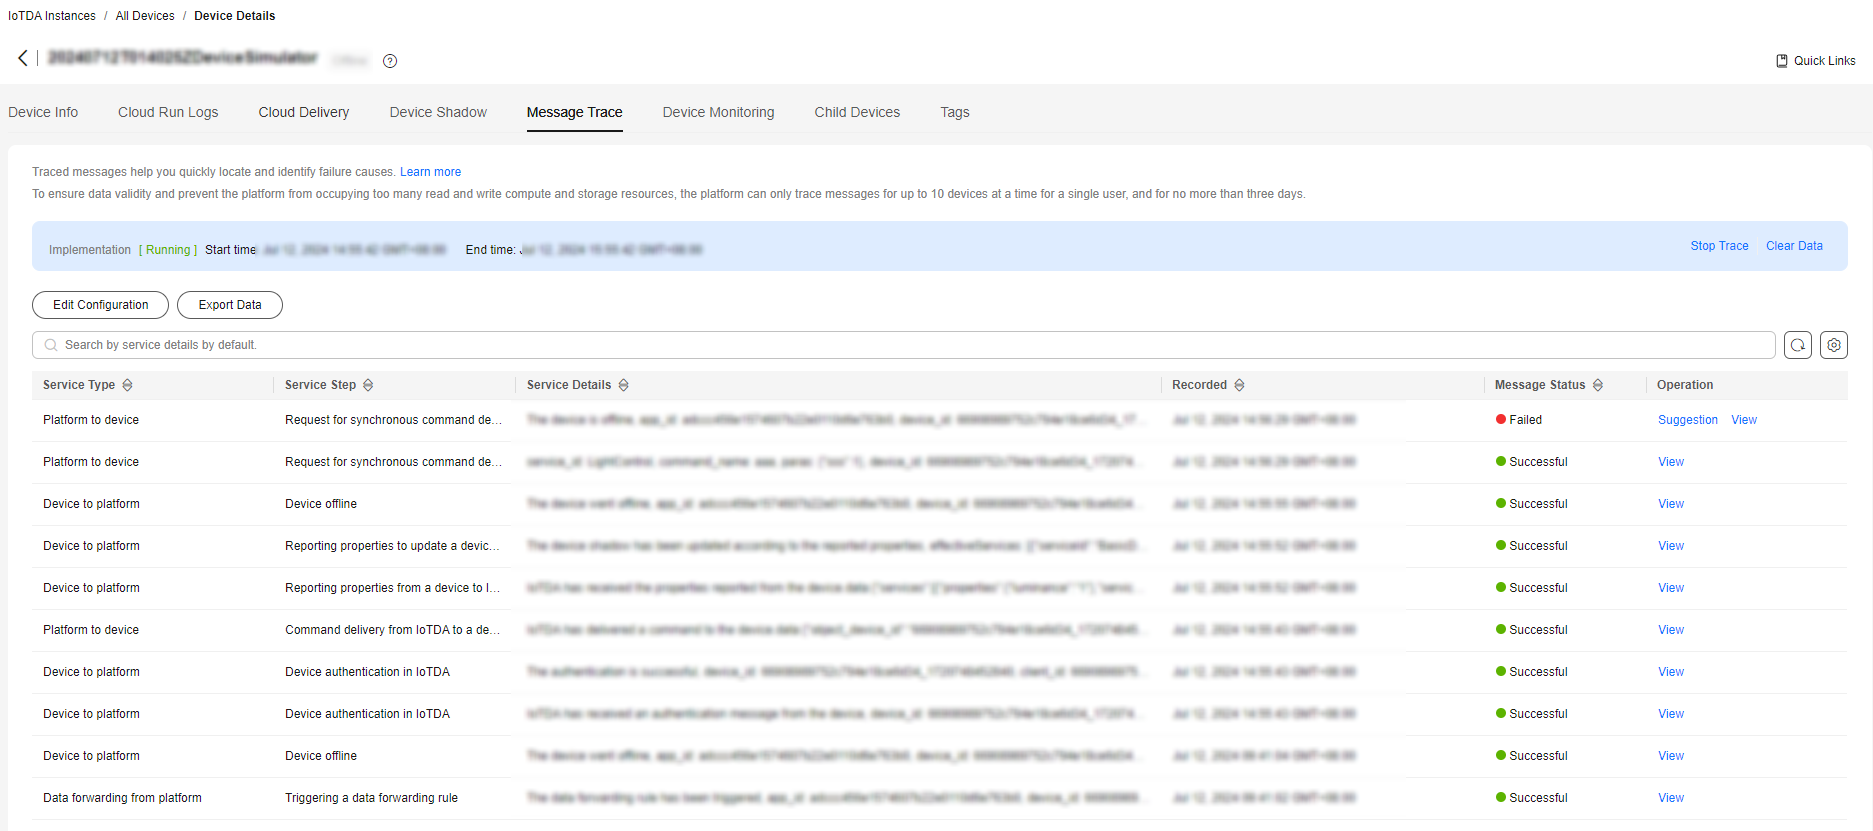
- View the services that are being traced. You can also click Stop Trace to stop the task.
If a large number of message trace records are displayed, you can filter the records by message status, service type, and recording time. If you need to further analyze the result data, you can export the data.
Figure 2 Message tracing - Viewing data
If the message status is Failed, you can click View to view the result details and locate the fault based on the failure handling suggestions.

During data reporting, you can specify request_id by adding ?request_id={request_id} after a topic. For example, use $oc/devices/{device_id}/sys/properties/report?request_id={request_id} for property reporting. If you do not specify request_id, the platform automatically generates one.
Feedback
Was this page helpful?
Provide feedbackThank you very much for your feedback. We will continue working to improve the documentation.See the reply and handling status in My Cloud VOC.
For any further questions, feel free to contact us through the chatbot.
Chatbot


