Security Situational Awareness
Overview
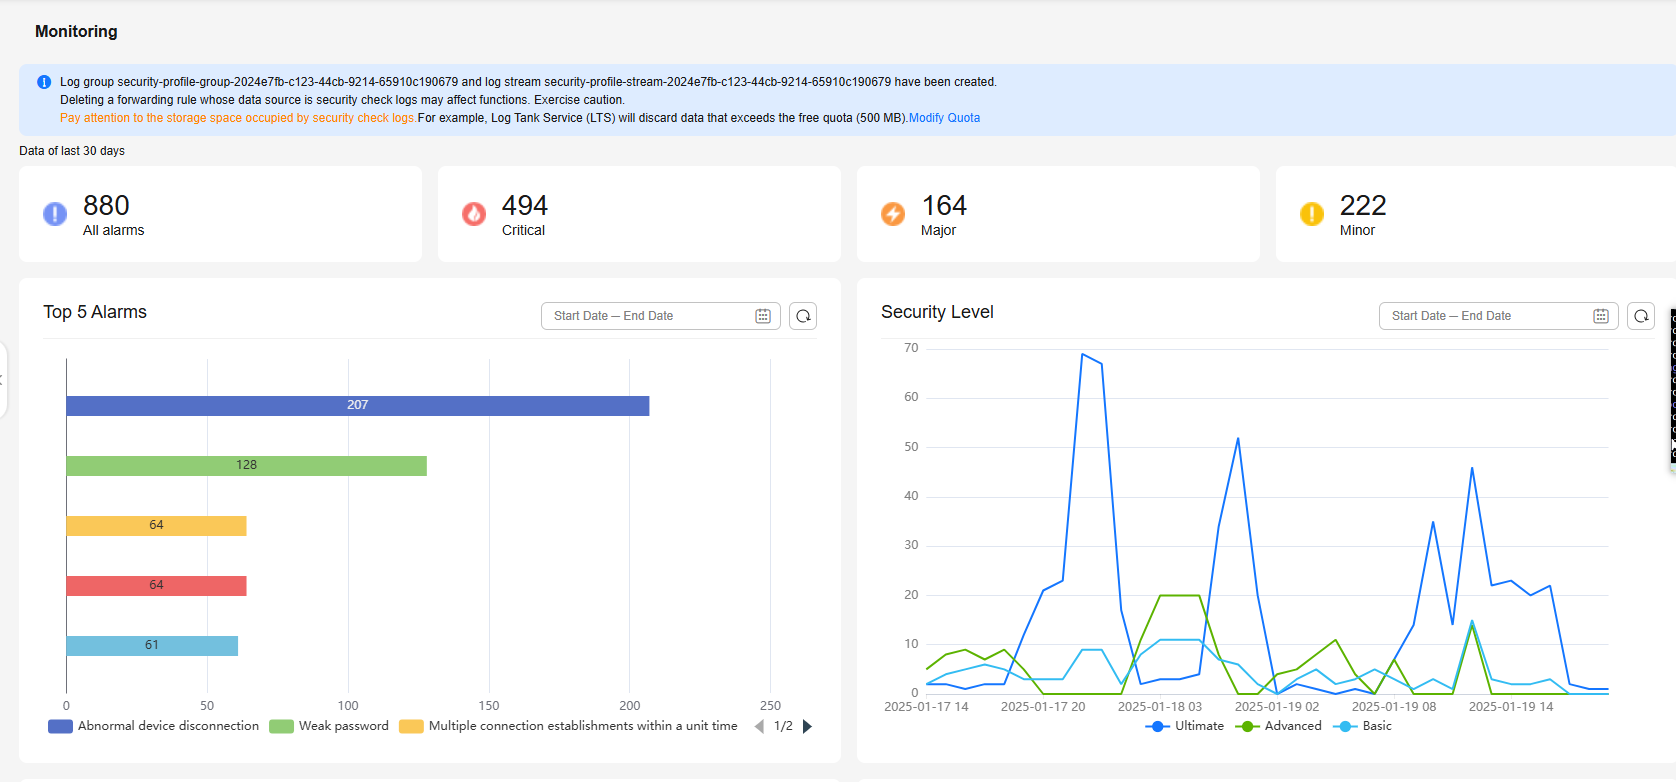
Security situational awareness is a unified risk monitoring and management system for IoTDA assets. It visualizes security management and collects statistics to improve governance efficiency.


Constraints
- Max. security items configured for a user: 100.
- Alarm suppression time (min. period for triggering and reporting an alarm) of the same check item on the same device: 1 hour.
Check Items
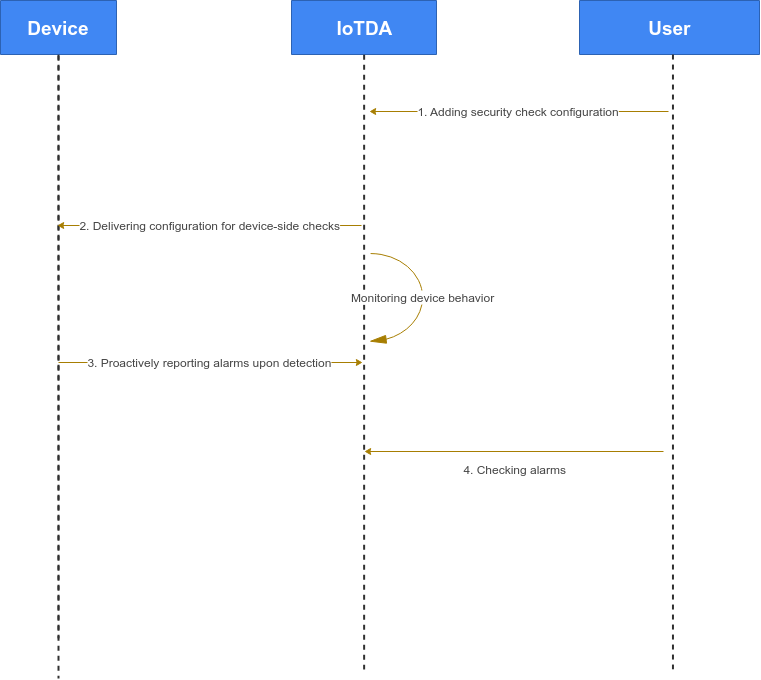
There are device-side and platform-side security checks. For device-side checks, you enable the function and set parameters on the platform. The configuration is then sent to the device for proactive alarm reporting. To save costs, it is recommended that you use the device SDK. For platform-side checks, the platform actively monitors the device and triggers alarms if necessary. The platform categorizes check items based on alarm severity (Critical, Major, and Minor) and security level (Ultimate, Advanced, and Basic). The table below lists the supported check items and their default severity levels. For details, see Anomaly Detection.
|
Item |
Default Severity |
Default Security Level |
Side |
Description |
|---|---|---|---|---|
|
Memory leak |
Critical |
Advanced |
Device |
Checks whether the memory usage of the device exceeds the threshold. |
|
Abnormal device ports |
Critical |
Advanced |
Device |
Checks whether the device uses a port that is not in the whitelist. |
|
Abnormal CPU usage |
Critical |
Advanced |
Device |
Checks whether the CPU usage of the device exceeds the threshold. |
|
Abnormal disk usage |
Critical |
Advanced |
Device |
Checks whether the disk usage of the device exceeds the threshold. |
|
Abnormal battery level |
Critical |
Advanced |
Device |
Checks whether the battery level of the device is lower than the threshold. |
|
Local device login |
Minor |
Basic |
Device |
Checks whether a local login behavior exists on the device. |
|
Brute-force login |
Minor |
Basic |
Device |
Checks whether brute-force attacks occur. |
|
Malicious IP addresses |
Minor |
Basic |
Device |
Checks whether the device is connected to a malicious IP address. |
|
Local file tampering |
Minor |
Basic |
Device |
Checks whether any file on the device is tampered with. |
|
Use of TLS |
Minor |
Ultimate |
Platform |
Checks whether the device uses an insecure port for access. |
|
Use of insecure TLS protocols |
Critical |
Ultimate |
Platform |
Checks whether the device uses an insecure TLS protocol version for access. |
|
Use of insecure TLS cryptographic algorithm suites |
Critical |
Ultimate |
Platform |
Checks whether the device uses an insecure TLS cryptographic algorithm suite for access. |
|
Device authentication failure |
Critical |
Ultimate |
Platform |
Checks whether the device authentication fails. |
|
Abnormal device disconnection |
Critical |
Ultimate |
Platform |
Checks whether the device goes offline unexpectedly. |
|
Multiple connection establishments within a specified time period |
Critical |
Ultimate |
Platform |
Checks whether the device establishes connections multiple times within a specified time period. |
|
Weak password |
Minor |
Ultimate |
Platform |
Checks whether the device uses a weak password. |
After the check items are configured on the device, the platform delivers the configuration to the device through the shadow. The service_id is $security_detection_config. The structure attributes are listed in the following table.
|
Key |
Value Type |
Description |
|---|---|---|
|
memoryCheck |
Integer |
Memory check status. Options: 0 (disable) and 1 (enable). |
|
memoryThreshold |
Integer |
Memory usage alarm threshold. Range (%): 1 to 100. |
|
memoryCheckReportPeriod |
Integer |
Memory check reporting period. Range: 1 to 24, in hours. |
|
portCheck |
Integer |
Port check status. Options: 0 (disable) and 1 (enable). |
|
portCheckReportPeriod |
Integer |
Port check report period. Range: 1 to 24, in hours. |
|
cpuUsageCheck |
Integer |
CPU check status. Options: 0 (disable) and 1 (enable). |
|
cpuUsageThreshold |
Integer |
CPU usage alarm threshold. Range (%): 1 to 100. |
|
cpuUsageCheckReportPeriod |
Integer |
CPU check reporting period. Range: 1 to 24, in hours. |
|
diskSpaceCheck |
Integer |
Disk check status. Options: 0 (disable) and 1 (enable). |
|
diskSpaceThreshold |
Integer |
Disk usage alarm threshold. Range (%): 1 to 100. |
|
diskSpaceCheckReportPeriod |
Integer |
Disk check reporting period. Range: 1 to 24, in hours. |
|
batteryPercentageCheck |
Integer |
Battery check status. Options: 0 (disable) and 1 (enable). |
|
batteryPercentageThreshold |
Integer |
Battery usage alarm threshold. Range (%): 1 to 100. |
|
batteryPercentageCheckReportPeriod |
Integer |
Battery check reporting period. Range: 1 to 24, in hours. |
|
loginLocalCheck |
Integer |
Local login check status. Options: 0 (disable) and 1 (enable). |
|
loginBruteForceCheck |
Integer |
Brute-force login check status. Options: 0 (disable) and 1 (enable). |
|
maliciousIPCheck |
Integer |
Malicious IP address check status. Options: 0 (disable) and 1 (enable). |
|
fileTamperCheck |
Integer |
File tampering check status. Options: 0 (disable) and 1 (enable). |
For details about the format of the device-side check result reporting, see Device Reporting Security Situational Awareness Alarms.
Service Flow

Procedure
- Access the IoTDA service page and click Access Console. Click the target instance card.
- In the navigation pane, choose Security > Configuration.
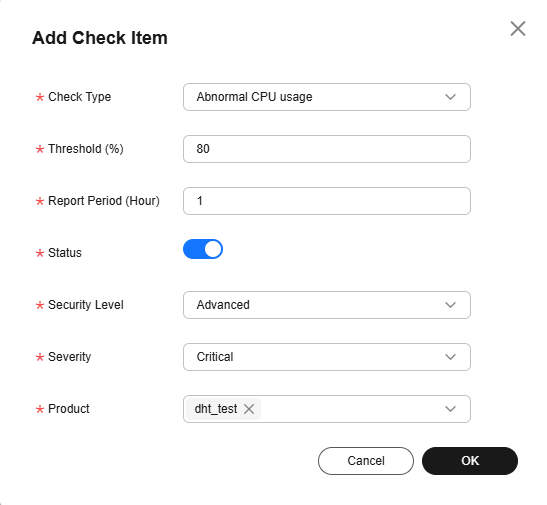
- Click Add Check Item.
Figure 4 Security situational awareness - Adding security check items

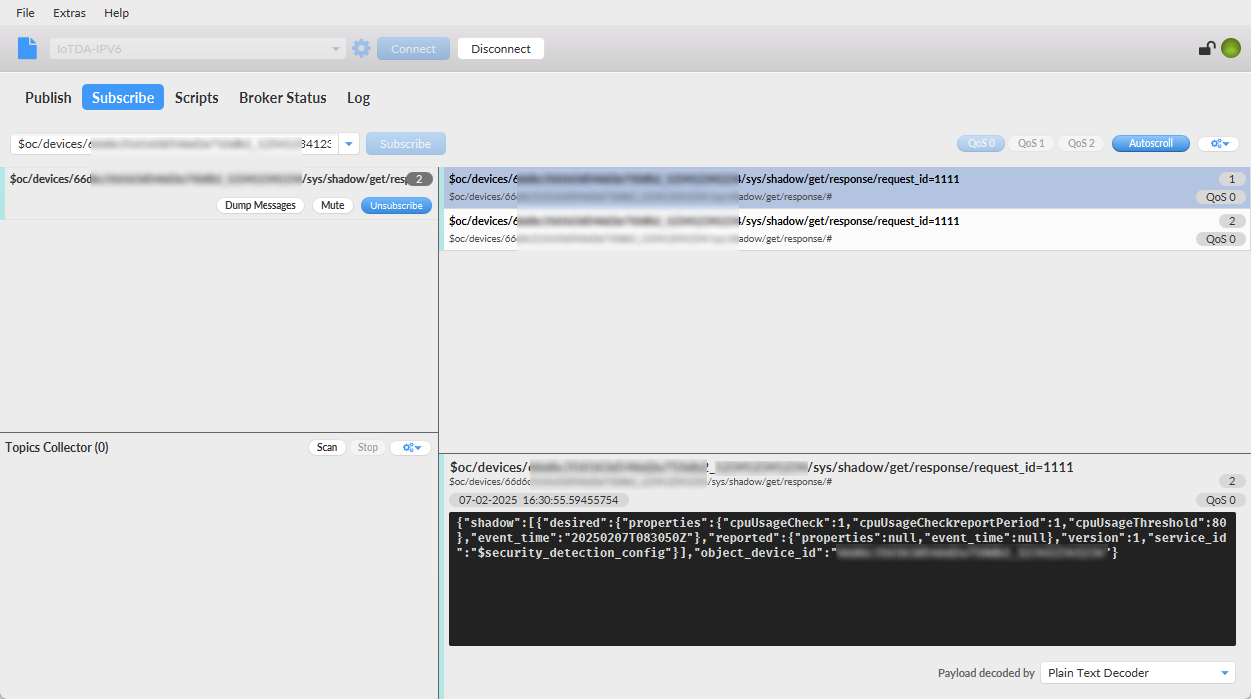
- The device connects to the platform and obtains the security situational awareness configuration. For details, see Device Obtaining Security Situational Awareness Configuration.
Figure 5 Security situational awareness - Checking security check configurations

- The device reports alarm data. The upstream topic is $oc/devices/{device_id}/sys/events/up. The content body is as follows:
{ "services": [{ "service_id": "$log", "event_type": "security_log_report", "event_time": "20250207T164812Z", "paras": { "type": "CPU_USAGE_REPORT", "content": { "cpu_usage": 99, "cpu_usage_alarm": 1 } } }] } - In the navigation pane, choose Security > Alarms to check the alarm list.
Figure 6 Security situational awareness - Checking security alarms

Feedback
Was this page helpful?
Provide feedbackThank you very much for your feedback. We will continue working to improve the documentation.See the reply and handling status in My Cloud VOC.
For any further questions, feel free to contact us through the chatbot.
Chatbot


