Displaying a Graph in 3D View
The 3D view of a graph provides you intuitive analysis experience.

Usage restrictions of the 3D display function:
- Memory edition: Only supports displaying the results of the PagePank algorithm, PersonalRank algorithm, DSL queries, Cypher queries, and Gremlin queries.
- Database edition: Only supports displaying the results of Cypher queries.
The results of other algorithms or queries can only be displayed in 2D mode.
Displaying a Graph in 3D View
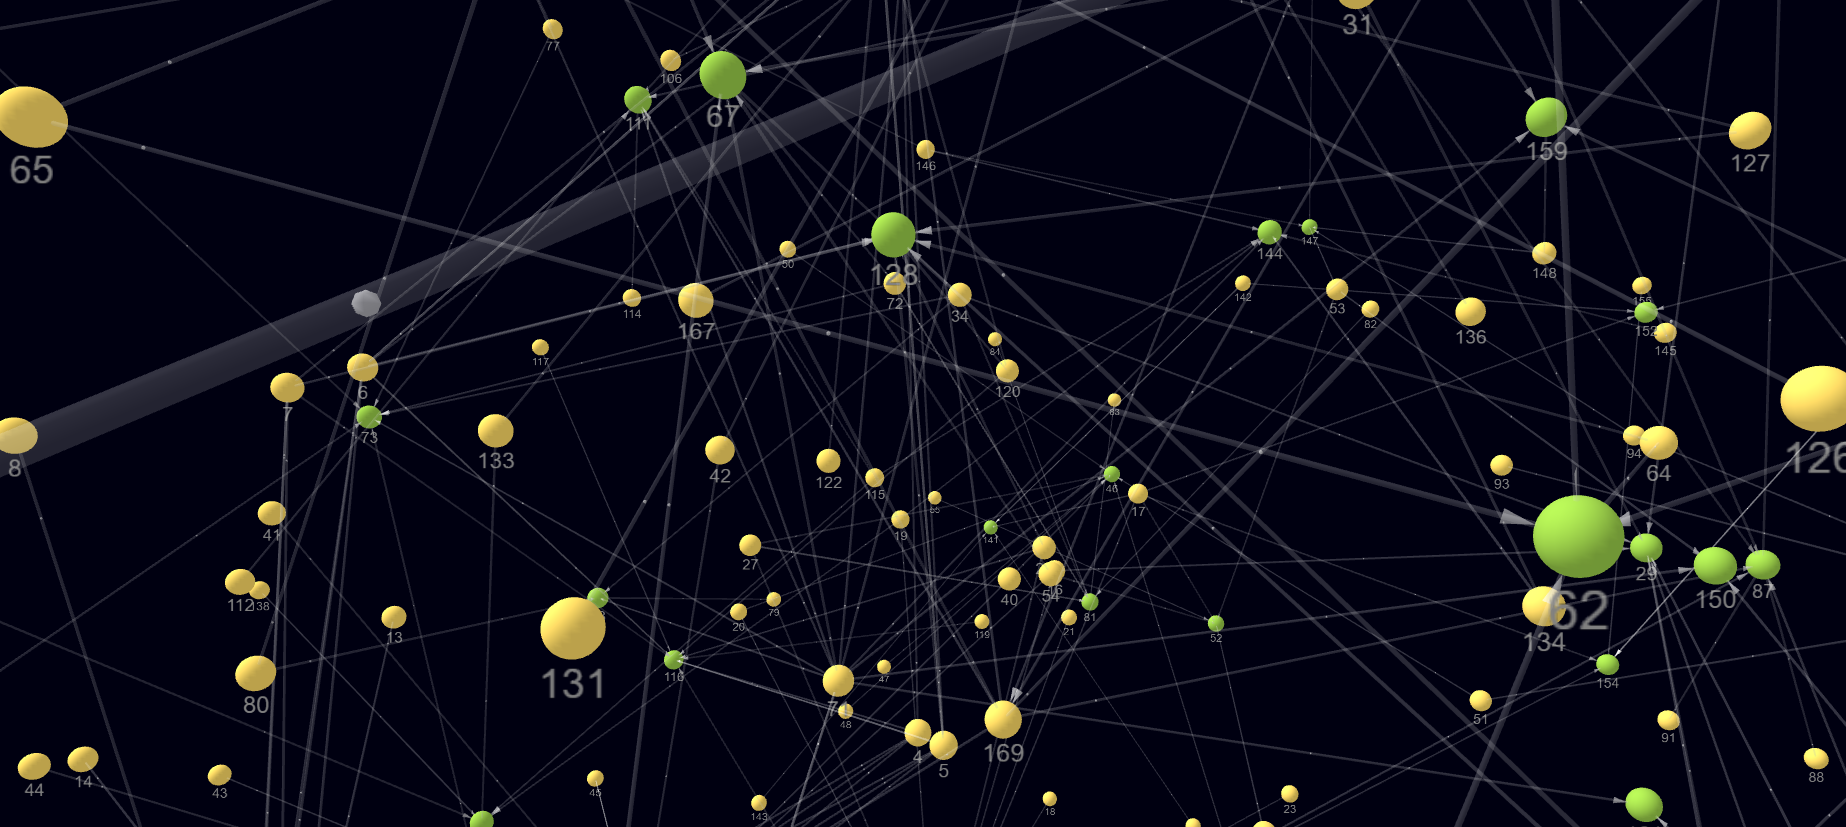
The following example shows how to view results of the PagePank algorithm in the 3D view graph:
- In the algorithm area on the left of the graph editor, select the PagePank algorithm and set required parameters.
- Run the algorithm. After the analysis is complete, you can view the result in the canvas.
- Click
 in the upper left corner of the canvas to switch to the 3D view.
Figure 1 3D view of the result
Feedback
Was this page helpful?
Provide feedbackThank you very much for your feedback. We will continue working to improve the documentation.See the reply and handling status in My Cloud VOC.
For any further questions, feel free to contact us through the chatbot.
Chatbot


