Creating a Dataset Through Visual Configuration
Datasets are an essential component in the process of data visualization and serve as an intermediary between data sources and visual representations. In DataArts Insight, you can create datasets by either visually configuring them or using custom SQL statements. This section describes how to create a dataset using the visual approach.
Prerequisites
- A project has been created by referring to Creating a Project.
- A data source has been connected by referring to Creating a Data Source.
Selecting a Data Table
- Log in to the DataArts Insight console.
- Click
 in the upper left corner of the management console to select a region. Then, select an enterprise project in the upper right corner.
 - On the top menu of the console, click Project. On the displayed My Projects page, click the name of the desired project.
- Choose Data Management > Datasets. On the displayed page, click Create Dataset.
- Double-click or drag a data table on the left to add it to the operation panel.
- Click Refresh Preview on the Data Preview tab to view the table data.
- Click
 of the data table and select Select Field. In the Edit Table slide-out panel, select the fields you want to display and click OK. To associate other data tables, refer to Creating a Model by Joining Multiple Tables.
Figure 1 Select Field
- Enter the dataset name and click Save.
Configuring Fields
You can configure dataset fields as needed. This includes editing, cloning, hiding, copying as indicators, converting to dimensions or metrics, setting default aggregation methods, numerical display formats, and deleting.

- If a data table contains more than 100 records, you can only preview the first 100. However, if the table has 100 records or less, you can preview all of them.
- Once a field is used in calculation fields, grouping dimensions, or filter criteria, you cannot modify its type, perform dimension or metric conversions on it, or delete it.
- Currently, the date field cannot be copied. You can convert the date field to the text type and then copy the field.
- Access the field configuration page using either of the following methods:
- In the field list area, click
 next to a field to configure the field.
 - In the data preview area, click
 next to a field to configure the field.
 -
Figure 2 Configuring fields

- In the field list area, click
- Select required operations, as described in Table 1.
|
Function |
Description |
|---|---|
|
Edit |
Edit the name and description of the field.
|
|
Clone |
Quickly copy a field. The new field contains the backup identifier.
|
|
Hide |
Hide a field. After a field is hidden, this field will not be displayed when you use this dataset to create a dashboard or large screen. |
|
Copy as Indicator |
Copy a metric and convert it to an indicator. |
|
Convert to Metric/Dimension |
Change the field type from dimension to metric or vice versa. |
|
Convert Dimension Type |
Convert a dimension or metric field to another type, such as a number, date, or text. You can configure the data format for a date field.
NOTE:
|
|
Default Aggregation Mode |
Select None, Sum, Average, Count, Distinct count, Maximum, Minimum, Population standard deviation, Sample standard deviation, Population variance, Sample variance, Range start value, or Range end value.
NOTE:
You can only set either Range start value or Range end value, not both at the same time. |
|
Numeric Display Format |
Options: No format, Numeric, Currency, Object quantifier, Length, Weight, Energy, Capacity, Time, and Percentage. |
|
Move To |
Use this function only when the new hierarchy or dataset is a table view. For details, see Creating a Hierarchy. |
|
Delete |
Delete a field. To retrieve the field after it is deleted, click the table in the canvas and select and add the field in the right pane. |
(Optional) Visual Configuration
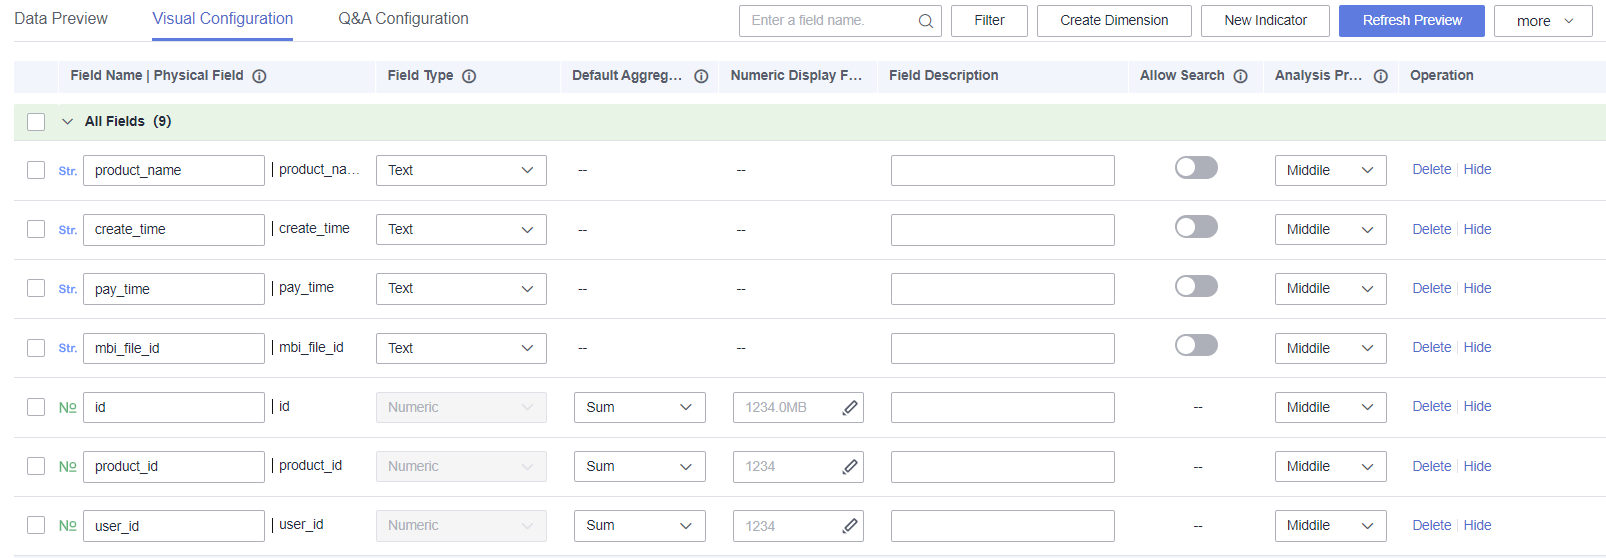
The visualization configuration feature provided by DataArts Insight allows you to easily configure dataset fields. It offers various parameter settings, such as the field name, field type, default aggregation method, numerical display format, field description, search permission, and analysis priority.
- Click the Visual Configuration tab.
- Select the field you want to modify and edit it as needed. For details, see Table 2.

- Clicking
 allows you to configure fields in batches, including converting dimensions to metrics in batches or vice versa, hiding or unhiding fields in batches, and deleting fields in batches.
 - You can drag and drop fields to adjust their display order. After making adjustments, click Save. The field order is successfully set. Subsequent Q&A sessions with the intelligent analysis assistant will return field content based on the configured order.
Figure 3 Visual configuration
Table 2 Visual configuration parameters Parameter
Description
Field Name | Physical Field
- You can customize field names, which will be shown in charts on dashboards and large screens.
- Physical fields cannot be modified.
Field Type
Type supported by a field, including date, text, and number. A date can be set in multiple formats.
Default Aggregation
The aggregation mode can be set only for metric fields.
Select None, Sum, Average, Count, Distinct count, Maximum, Minimum, Population standard deviation, Sample standard deviation, Population variance, Sample variance, Range start value, or Range end value.
NOTE:You can only set either Range start value or Range end value, not both at the same time.
Numeric Display Format
Select No format, Numeric, Currency, Object quantifier, Length, Weight, Energy, Capacity, Time, or Percentage.
Field Description
Description of a field.
Allow Search
Determines whether the enumerated values used to label fields can be searched during synchronization with the intelligent analysis assistant. Currently, only a maximum of 1,000 enumerated values can be extracted.
NOTE:It is supported only by the text type.
Analysis Priority
Determines the priority of fields selected for analysis by the automatic insights feature of the intelligent analysis assistant. A maximum of 10 high-priority fields can be configured.
Operation
You can delete or hide a field. You can unhide a hidden field.
NOTE:Before deleting a field from a dataset, check whether the field is used in a large screen, report, or permission configuration.
- Clicking
(Optional) Q&A Configuration
When the newly created dataset is associated with the intelligent analysis assistant, you can perform Q&A configuration to optimize the Q&A experience of the assistant.
- Synonym configuration
The intelligent analysis assistant understands questions and data based on configured synonyms, which can improve the accuracy of Q&A.
- In the dataset list, click the name of the dataset for which you want to configure associated fields. On the displayed page, click the Q&A Configuration tab.
- Enter synonyms for fields in the synonym box and press Enter to save. For example, you can set the synonyms for product_name as product name and product ID.
- Click Publish Synonyms in the Operation column. The published synonym is saved to the public thesaurus. You can publish synonyms in batches by selecting them and clicking Releasing Synonyms in Batches.

If Releasing Synonyms in Batches is grayed out after selecting multiple synonyms, you must first deselect the published ones before you can publish the rest in batches.
Figure 4 Synonym configuration
- Configure synonyms for enumerated values.
- Click Value synonym in the Operation column.
- Enter enumerated values in the enumerated value box, then enter synonyms in the synonym box and press Enter to save.
- Click Publish Synonyms in the Operation column to publish the synonym. A published synonym cannot be deleted on the Q&A page but can be deleted on the synonym page.
- Auto-associate synonym:
- Select the fields you want to associate and click Auto-Associate Synonym. The synonyms of the fields and enumeration values in the public thesaurus will be matched. If there is no matching synonym in the public thesaurus for a field, it will not be matched.
- Associated field configuration
After configuring the associated fields, the intelligent analysis assistant will recommend related questions based on the dimension and metric associated fields, helping you better understand the data.

- When the associated field of Dimension is Metric, associated questions will not be generated on the intelligent analysis assistant's Q&A page. You are advised to configure the associated field as Dimension.
- When the associated field of Metric is only Dimension, associated questions will not be generated on the intelligent analysis assistant's Q&A page. You are advised to configure the associated field as Metric or to include both Metric and Dimension.
- Generate associated questions based on three categories: Indicator, Dimension, and Metric. Each category generates a maximum of one associated question, with a total of no more than three associated questions.
- In the dataset list, click the name of the dataset for which you want to configure associated fields. On the displayed page, click the Q&A Configuration tab.
- Click
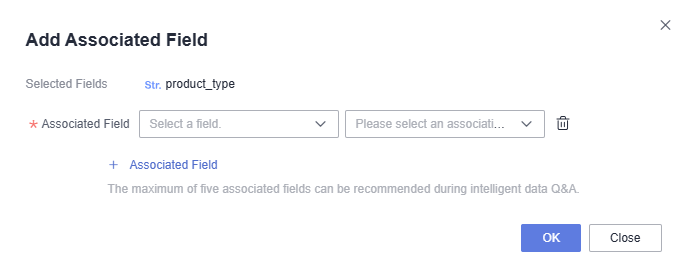
 . In the dialog box that appears, select the fields you want to associate. In this example, the associated field of product_name is set to product_type.
Figure 5 Adding an associated field
- Click OK. The associated fields are successfully configured. When asking questions related to product_name on the intelligent analysis assistant page, related questions about product_type will be automatically recommended.
Batch Changing Names
Batch renaming is a feature that allows you to batch upload physical fields, field names, and field descriptions of the data table you want to analyze. This improves efficiency and user experience by automatically populating the fields, and is mainly used in scenarios where a data table contains a large number of physical fields.
- Restrictions: You can only upload files in .xlsx, .xls, or .csv format, and the file size cannot exceed 3 MB.
- Procedure:
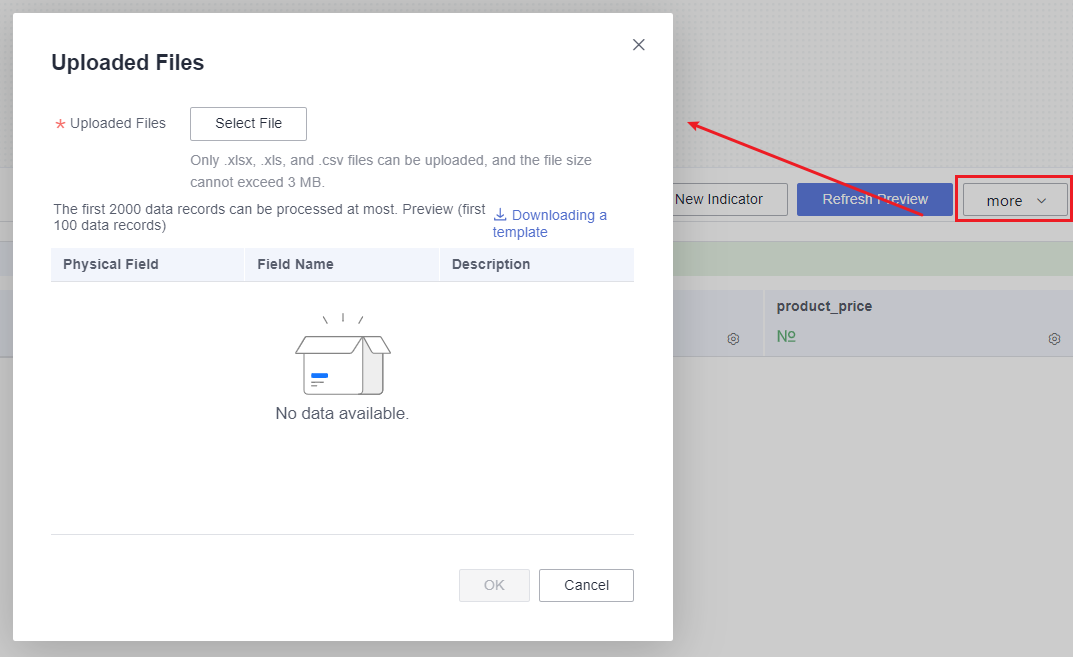
- On the dataset editing page, click More and select Batch Modify Names.
Figure 6 Batch renaming

- In the displayed Uploaded Files dialog box, click Download Template. Fill in the template.
- Click Select File and upload the completed file.

- Preview only displays up to 100 entries, but the actual data table contains 2,000 entries.
- You can upload up to 2,000 entries per file upload, and any remaining entries will need to be uploaded again.
- Click OK.
- On the dataset editing page, click More and select Batch Modify Names.
Feedback
Was this page helpful?
Provide feedbackThank you very much for your feedback. We will continue working to improve the documentation.See the reply and handling status in My Cloud VOC.
For any further questions, feel free to contact us through the chatbot.
Chatbot


