
Updated on 2025-05-20 GMT+08:00
Creating a Hierarchy
Hierarchy is an effective way to organize data by categorizing dimension values. For example, grades can be divided into several different levels, such as "fail," "pass," "good," and "excellent". This grouping allows for a clear observation of the distribution of student numbers in each grade level. This section describes how to create a hierarchy.
Prerequisites
- A project has been created by referring to Creating a Project.
- A data source has been connected by referring to Connecting to a Data Source.
- A dataset has been created by referring to Creating a Dataset.
Procedure
- Log in to the DataArts Insight console.
- Click
 in the upper left corner of the management console to select a region. Then, select an enterprise project in the upper right corner.
 - On the top menu of the console, click Project. On the displayed My Projects page, click the name of the desired project.
- In the navigation pane on the left, choose Data Management > Datasets.
- On the displayed page, click the name of the dataset you created.
- On the Data Preview tab, click More and select Create Hierarchy.
- In the dialog box that appears, enter a name, select one or multiple dimensions, and click OK.

Date fields cannot be used to create a hierarchy.
Figure 1 Creating a hierarchy
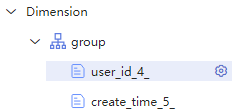
- After saving the configuration, the dataset will add this hierarchy as a dimension field and fill in the grouping names in the corresponding column according to the configuration. This hierarchy can then be used to create charts in subsequent chart-making processes.
Figure 2 New hierarchy
Parent topic: Creating a Data Model
Feedback
Was this page helpful?
Provide feedbackThank you very much for your feedback. We will continue working to improve the documentation.See the reply and handling status in My Cloud VOC.
The system is busy. Please try again later.
For any further questions, feel free to contact us through the chatbot.
Chatbot


