Viewing O&M Metrics on O&M BI Dashboards
Prerequisites
If you use O&M BI dashboard in single-account scenarios, skip this section and go to O&M BI Dashboards.
If you use O&M BI dashboards in cross-account scenarios, ensure that the following conditions are met:
1. Cross-account management has been enabled for the current account, and the account is an organization or delegated administrator account.
2. The COC service has been enabled for the organization member accounts of the current account.
Scenarios
This module provides O&M BI dashboards with diverse metrics, including those for monitoring incidents, alarms, security compliance, service level objectives (SLOs), and production readiness reviews (PRRs). It offers an enterprise-grade O&M sandbox to help you understand your overall O&M situation from both bird's eye and ground level views.
- The dedicated O&M BI dashboard caters to various O&M personnel, aiding in O&M optimization, insights, and decision-making.
- COC provides 30+ preset O&M metrics, delivering insights into your cloud resources across seven-perspective BI dashboards and a comprehensive enterprise-grade O&M sandbox.
- Organization administrators or delegated administrators can view the O&M situation data of organization member accounts across accounts, and aggregate data of multiple regions and applications across accounts.
Notes and Constraints
Data precision: SLO is accurate to three decimal places, and other metrics such as period-over-period change and percent are accurate to two decimal places.
O&M BI Dashboards
- Log in to COC.
- In the navigation tree on the left, choose Overview.
- Click O&M BI in the upper right corner. The O&M BI page is displayed.
- Filter O&M situation information by organization account, region, application, and date.
Figure 1 Filtering data by organization account
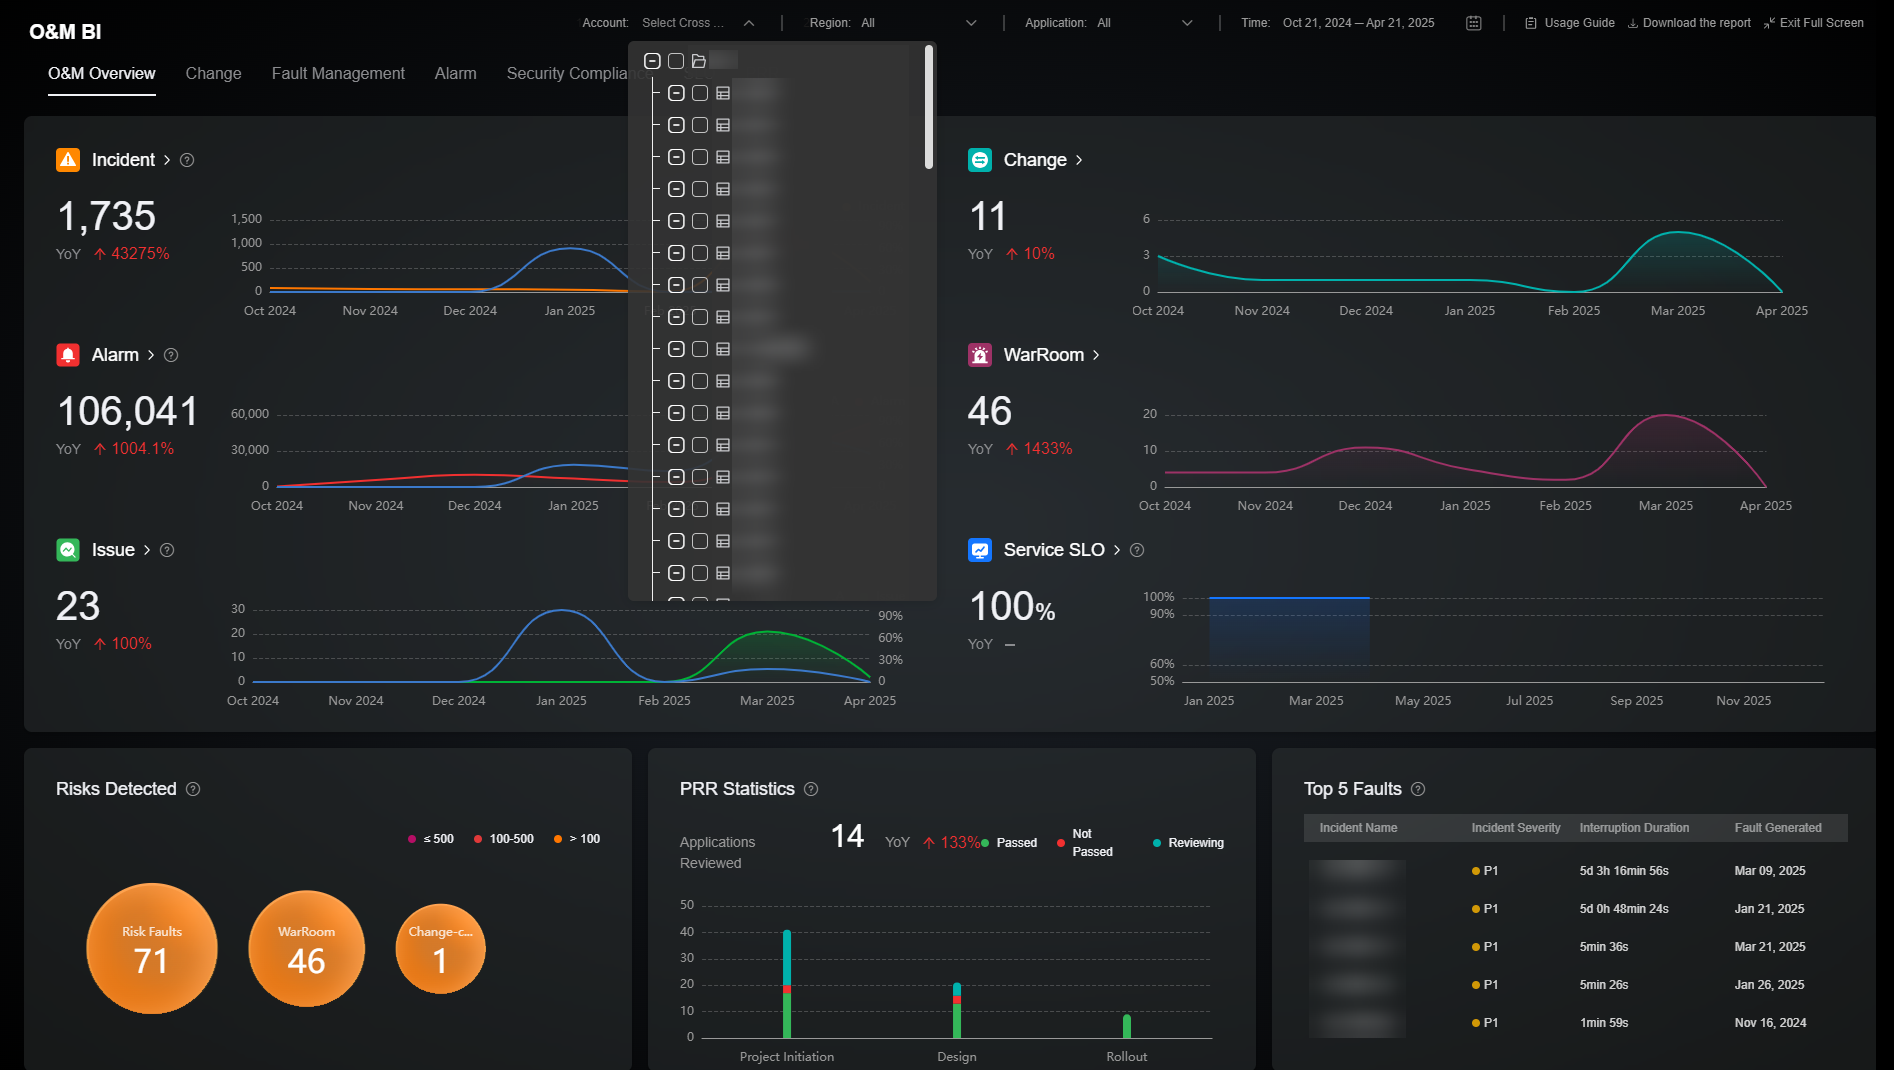

In the cross-account scenario, if no account is selected, the O&M situation data of the current account is displayed by default.
Except the raw alarm data, other O&M BI dashboard data is updated at T+1.
Figure 2 Application data aggregation in cross-account scenarios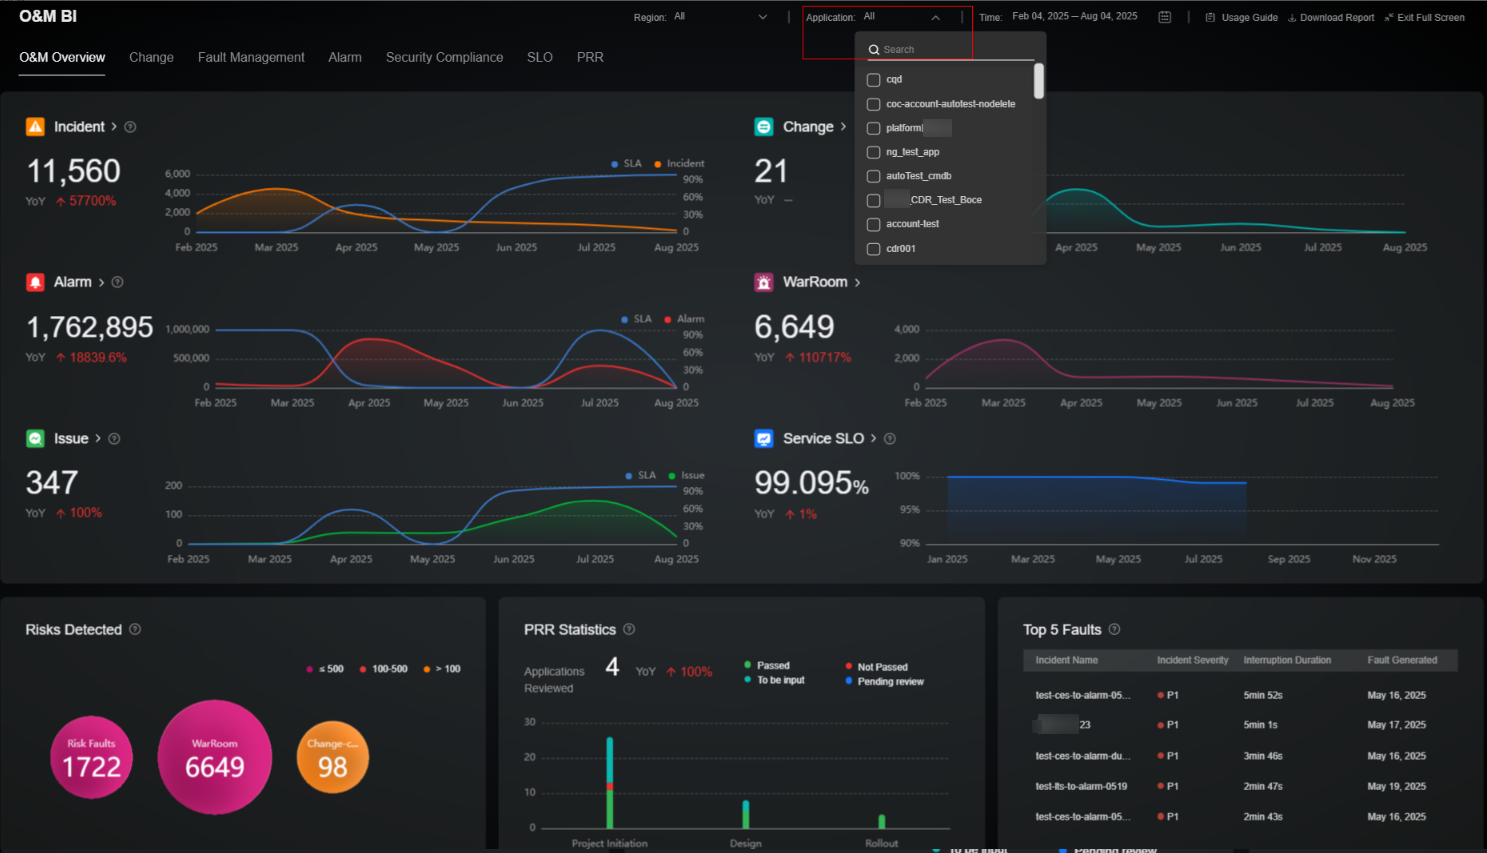
- Click a tab in the upper left corner to switch between O&M metric dashboards.
The O&M dashboards includes seven core modules: O&M overview, change management, fault management, monitoring and alerting, security compliance, SLO dashboard, and PRR dashboard. The following describes the functions and metrics of each dashboard.
The O&M Overview page consists of overview data, risks detected, PRR statistics, and top 5 faults. The overview module enables you to observe the O&M situation from the global perspective, facilitating O&M optimization, insights, and decision-making. The risks detected module displays the number of risk faults, war rooms, and change-caused faults. The PRR statistics module provides the review statuses of your applications before they are released or put into commercial use. The top 5 faults module displays the incidents that have the most severe impacts on your services to help you quickly identify major fault scenarios. For details about the metrics included, see Table 1.
The rules for collecting statistics on O&M overview data are as follows:
- Incidents in the draft or closed state are not included in the statistical scope.
- The statistical scope does not include canceled and pending issue tickets.
- Only the number of alarms in the alerting state is included.
- Only completed change tickets are included.
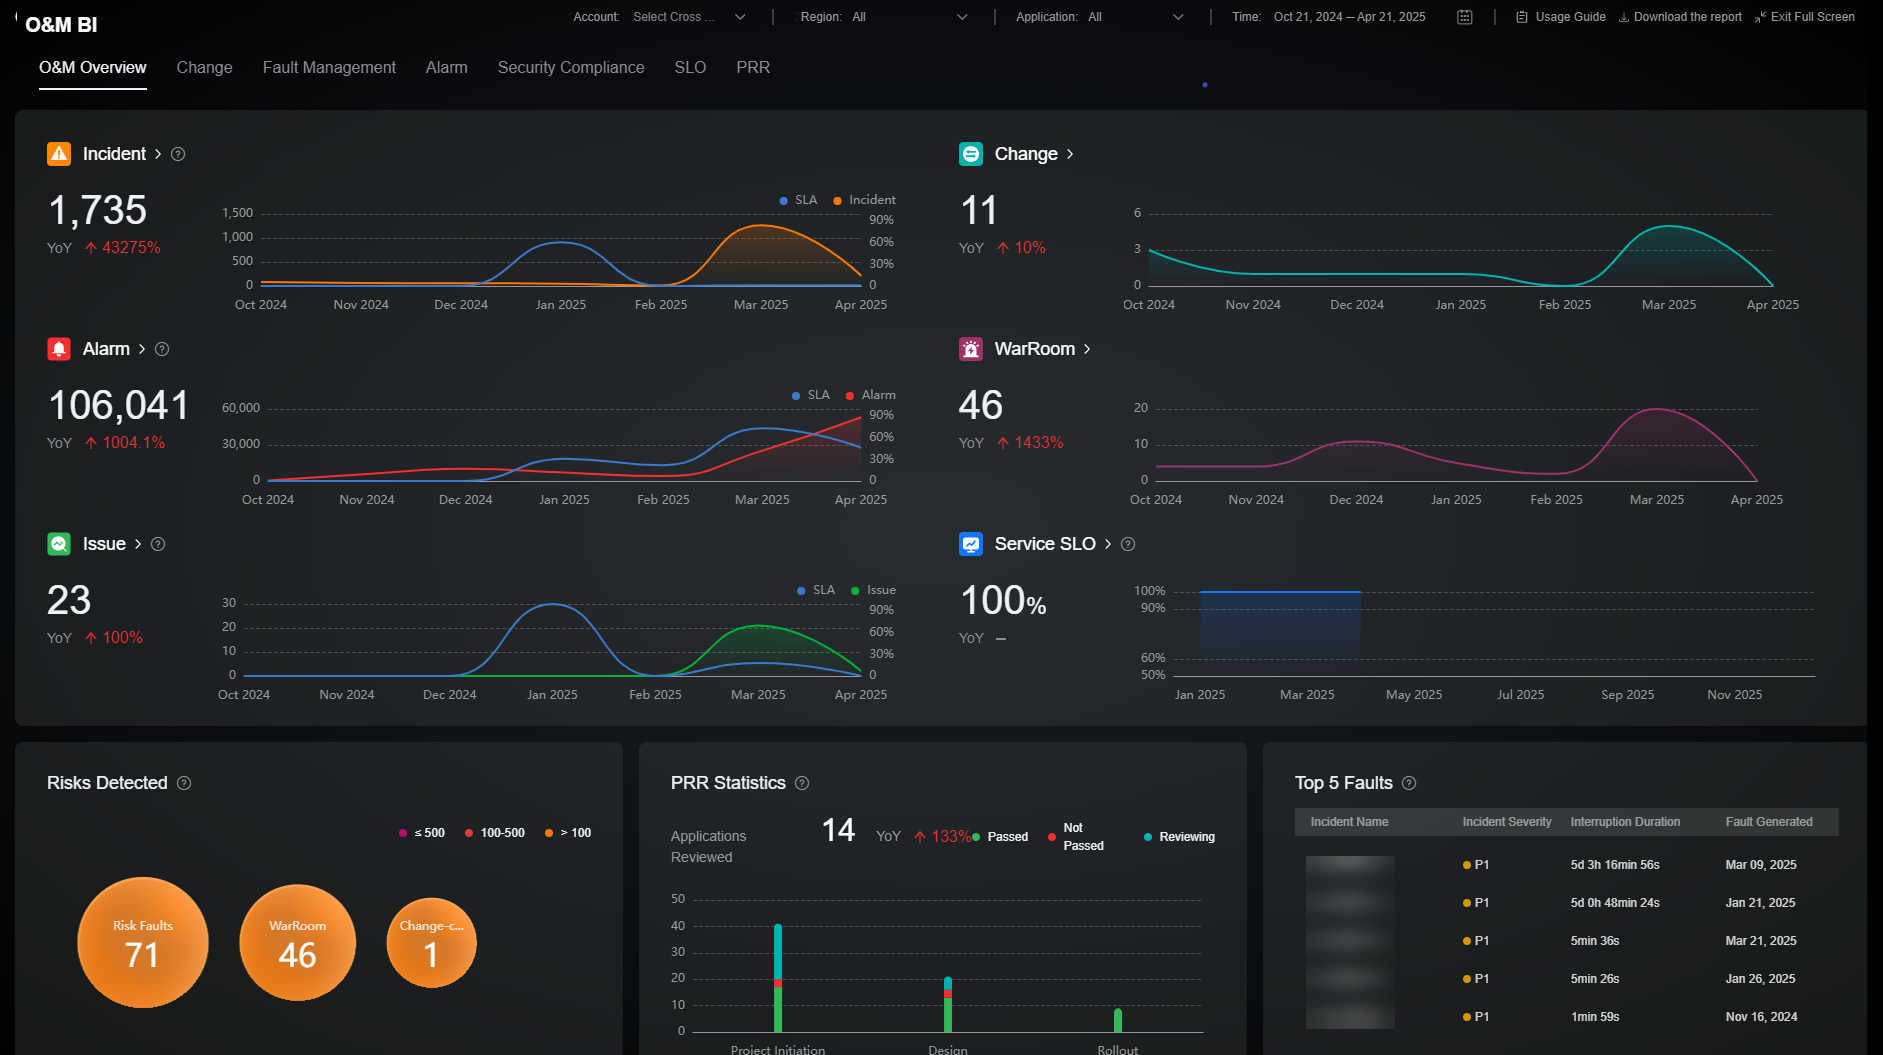
Note: In the O&M overview module, the number of incidents in the draft or closed state is not included. The number of issue tickets in the canceled or to-be-submitted state is not included. Only the number of alarms in the alerting state is included. Only the number of changes in the completed state is included.
|
Module |
Metric |
Data Source |
Metric Definition |
Calculation Rule |
Statistical Period |
Unit |
|---|---|---|---|---|---|---|
|
Overview |
Incident |
Incident center |
Collects the trend of the incident ticket quantity. |
Collect the number of incident tickets created in a selected period. |
Day or month |
Count |
|
Alarm |
Alarm center |
Collects the trend of the aggregated alarm quantity. |
Collect the number of aggregated alarms created in a selected period. |
Day or month |
Count |
|
|
Issue |
Issue management |
Collects the trend of the number of issue tickets |
Collect the number of issue tickets created in a selected period. |
Day or month |
Count |
|
|
WarRoom |
War rooms |
Collects the war room quantity trend. |
Collect the number of all war rooms set up in a selected period. |
Day or month |
Count |
|
|
Change |
Change management |
Collects the trend of the number of change tickets |
Collect the number of change tickets created in a selected period. |
Day or month |
Count |
|
|
Service SLO |
SLO management |
Collects the change trend of the actual SLO value of a cloud service. |
Actual SLO value = 1 – (Service unavailability duration/Total cloud service duration) × 100% |
Day or month |
% |
|
|
Risks Detected |
Change-caused Faults |
Incident management |
Collects the number of incidents caused by changes. |
Collect the number of incident tickets whose incident type is change operation. |
Day or month |
Count |
|
Risk Faults |
Incident management |
Calculates the number of P3 or more severe incidents. |
Collect the total number of P1, P2, and P3 incidents, including unhandled incidents. |
Day or month |
Count |
|
|
War room |
Alarm center |
Collects the number of war rooms. |
Collect the number of all war rooms set up in a selected period. |
Day or month |
Count |
|
|
PRR Statistics |
Applications covered by PRR |
PRR |
Collects the number of applications that are covered by a PRR. |
Collect the number of applications that are covered by a PRR. |
Day or month |
Count |
|
Applications Passed in PRR Statistics |
PRR |
Collects the number of services passed or failed a PRR in each PRR phase. |
Collect the number of services passed or failed a PRR in each PRR phase. |
Day or month |
Count |
|
|
Top 5 Faults |
Top 5 Faults |
Incident management |
Collects the top 5 most severe incidents. |
Collect the number of handled P3 or more severe incidents in a specified period, rank the incidents by severity first and then by interruption duration to obtain the top 5 most severe incidents. |
Day or month |
Incident information |
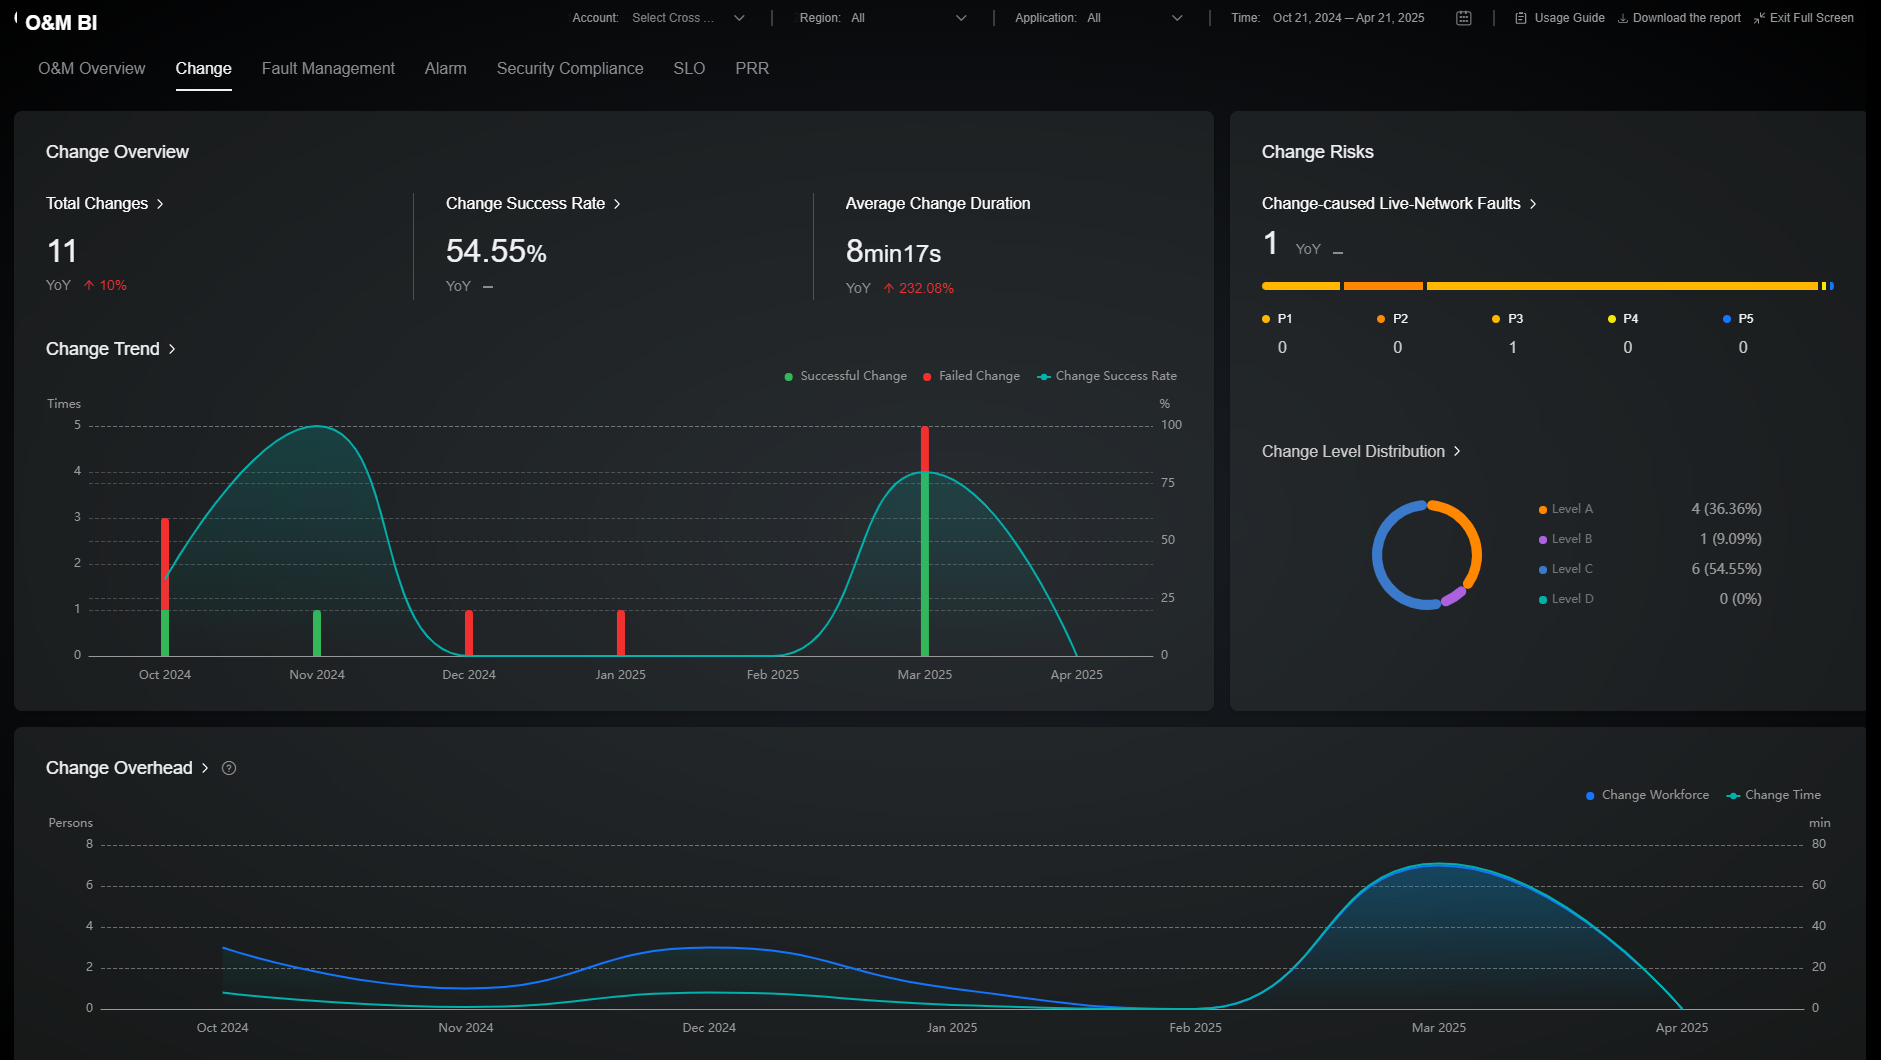
The Changes page consists of change overview, change overhead, and change risks, which are key change metrics. The change overview area displays key change metrics, such as the average change duration and success rate, and provides Period over Period (PoP) data and trend charts to show the overall change status. The change risks area displays the faults caused by changes and provides the change level distribution charts. The change overhead area displays the trends of the persons required and time consumed by your services in a specified period so that you can control your change overhead as required. For details about the metrics included, see Table 2.
|
Module |
Metric |
Data Source |
Metric Definition |
Calculation Rule |
Statistical Period |
Unit |
|---|---|---|---|---|---|---|
|
Change Overview |
Total Changes |
Change management |
Collects the number of change tickets. |
Collect the number of change tickets completed in a selected period. |
Day or month |
Count |
|
Change Success Rate |
Change management |
Collects the success rate of change tickets. |
Metric value = Number change tickets that are handled/Total number of change tickets that are handled and failed × 100% |
Day or month |
% |
|
|
Average Change Duration |
Change management |
Collects the average duration for handling change tickets. |
Metric value = Total duration required by handled change tickets in a selected period/Number of handled change tickets × 100% |
Day or month |
ddhhmm |
|
|
Change Trend |
Change management |
Collects the number of successful and failed changes and change success rate trend. |
Collect the number of successful and failed changes and change success rate trend. |
Day or month |
Count |
|
|
Change Overhead |
Change Manpower |
Change management |
Collects the number of O&M engineers required in changes. |
Collect the number of change coordinators and the number of change implementers. |
Day or month |
Person-time |
|
Change Duration |
Change management |
Collects the average handling duration of change tickets. |
Metric value = Total duration required by handled change tickets in a selected period/Number of handled change tickets × 100% |
Day or month |
ddhhmm |
|
|
Change Risks |
Change-caused Live-Network Faults |
Change management |
Collects the number of change-caused incidents of each level on the live network. |
Collect the number of incident tickets created for each level of incidents that are caused by changes within a selected time range. |
Day or month |
Count |
|
Change Level |
Change management |
Collects the number of change tickets for each level of changes. |
Collect the number of change tickets for each level of changes in a selected period. |
Day or month |
Count |
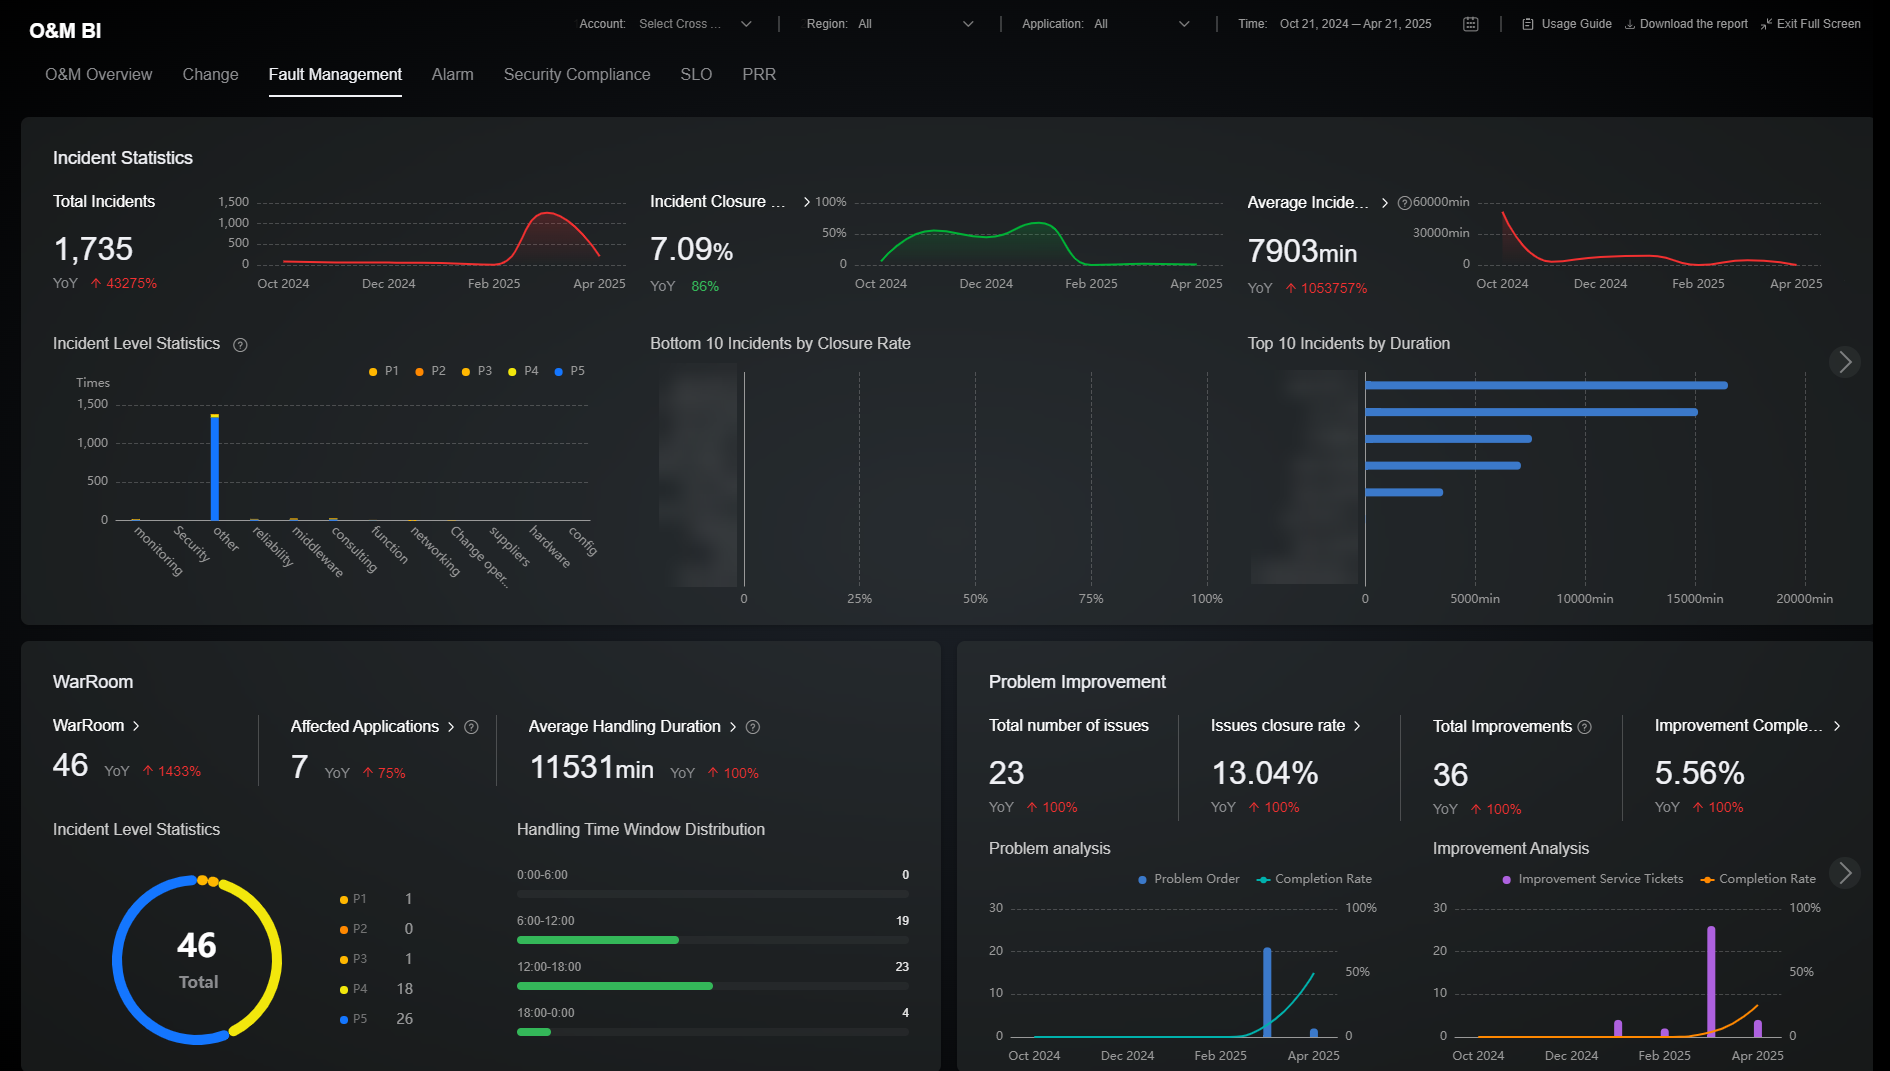
The Fault Management page consists of incident statistics, war rooms, and problem improvement, which are key metrics of incident management. The incident statistics area displays incident quantity, closure rate, rectification duration, affected applications, and SLA fulfillment the rate. Incident risks are analyzed in forms of PoP changes, trend charts, and top or bottom incidents. The WarRoom area displays affected applications, incident level statistics, and handling time window distribution, which are key metrics for the occurrence and improvement of major faults. The problem improvement area includes the issue closure rate and trend analysis of problem improvement to ensure that experience in handling known faults is accumulated, reducing the frequency and handling duration of similar faults. For details about the metrics included, see Table 3.
|
Module |
Metric |
Data Source |
Metric Definition |
Calculation Rule |
Statistical Period |
Unit |
|---|---|---|---|---|---|---|
|
Incident statistics |
Total Incidents |
Incident management |
Collects the total number of incident tickets. |
Collect the number of incident tickets created in a selected period. Note: Incident tickets in the draft or closed state are not counted. |
Day or month |
Count |
|
Incident Level |
Incident management |
Collects the number of incident tickets of each type and level. |
Collect the number of incident tickets of each type and level within a selected time range. |
Day or month |
Count |
|
|
Incident Closure Rate |
Incident management |
Collects the closure rate of incident tickets. |
Metric value = Number of incident tickets in the "Completed" status in the selected time period/Total number of incident tickets × 100% |
Day or month |
% |
|
|
Average Incident Duration |
Incident management |
Collects the average handling duration of incident tickets. |
Metric value = Total handling duration of closed incidents/Number of closed incidents × 100% |
Day or month |
ddhhmm |
|
|
Affected Applications |
Incident management |
Collects the number of applications affected by an incident ticket. |
Collect the number of affected applications (including deleted applications) of an incident ticket after deduplication. |
Day or month |
Count |
|
|
Incident SLA Fulfillment Rate |
SLA management |
Collects statistics on the SLA fulfillment status of incident tickets. |
Metric value = Number of incident tickets that do not violate the SLA/Total number of incident tickets included in the statistics × 100% |
Day or month |
% |
|
|
War Rooms |
WarRoom |
War rooms |
Collects the number of all war rooms set up. |
Collect the number of all war rooms set up in a selected period. |
Day or month |
Count |
|
Incident Level |
Incident management |
Collects the number of incidents of each level for setting up war rooms. |
Collect the number of incidents of each level for setting up war rooms. |
Day or month |
Count |
|
|
Affected Applications |
War rooms |
Collects the number of affected applications for setting up war rooms. |
Calculate the number of affected applications for setting up war rooms after deduplication. |
Day or month |
Count |
|
|
Average Handling Duration |
War rooms |
Collects the average duration for fault recovery from setting up war rooms. |
Collect the total handling time of stopped war rooms in the selected period/Number of stopped war rooms. |
Day or month |
ddhhmm |
|
|
Handling Time Window Distribution |
War rooms |
Collects the number of times war rooms are set up in each time window. |
Collect the number of times war rooms are set up in each time window. |
Day or month |
Count |
|
|
Problem Improvement |
Total Issues |
Issue management |
Collects the number of issue tickets. |
Collect the number of all issue tickets within a specified period except those in the canceled and to-be-submitted states. |
Day or month |
Count |
|
Issue Closure Rate |
Issue management |
Collects the closure rate of issue tickets. |
Metric value = Number of completed issue tickets/Total number of issue tickets × 100% |
Day or month |
% |
|
|
Total Improvement Tickets |
Improvement ticket management |
Collects the number of improvement tickets. |
Collect the number of all improvement tickets within a specified period except those in the draft state. |
Day or month |
Count |
|
|
Improvement Ticket Completion Rate |
Improvement ticket management |
Collects the closure rate of improvement tickets. |
Metric value = Number of completed improvement tickets/Total number of improvement tickets × 100% |
Day or month |
% |
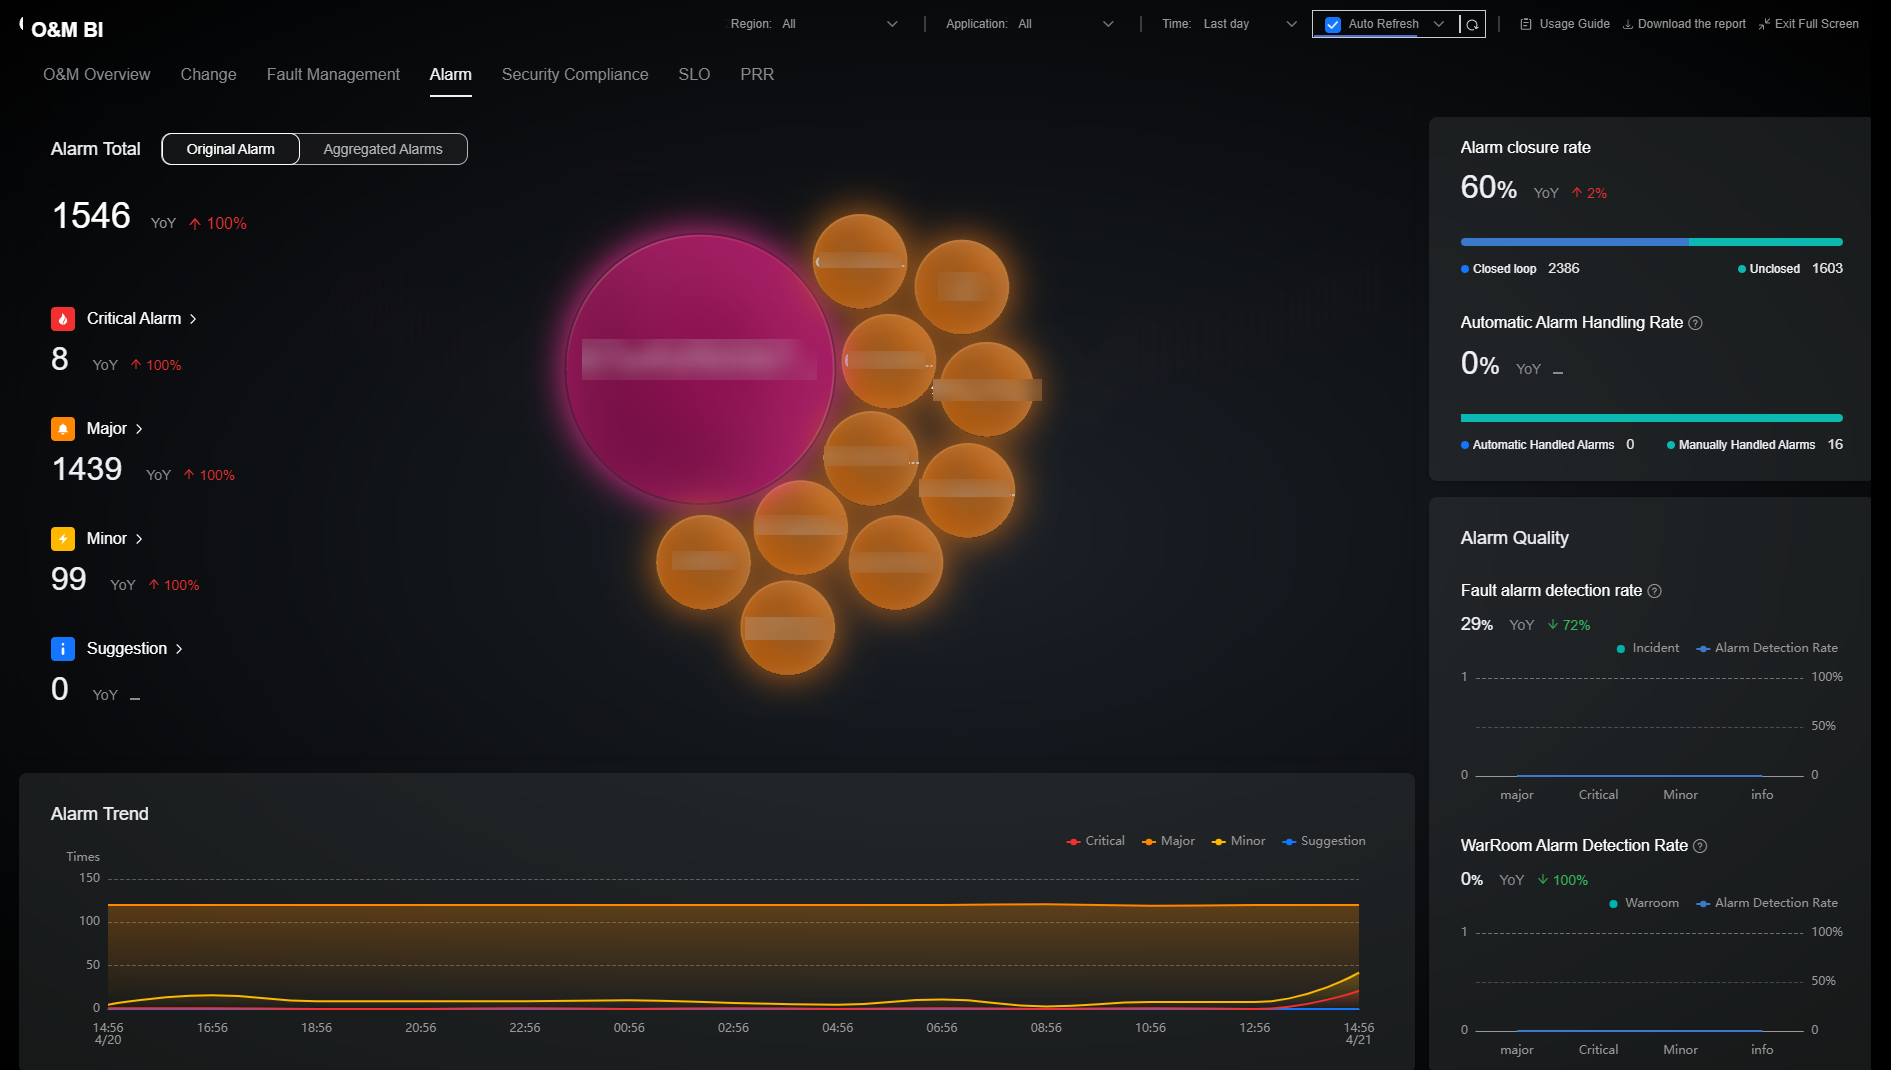
The Alarm page displays alarm analysis, alarm costs, and alarm quality. These are key metrics displayed in charts. O&M personnel can quickly learn about the overall service status. The alarm analysis area displays the total number of alarms, alarm severity, top applications, alarm reduction, and alarm trend. By analyzing historical alarm data, the O&M supervisor can understand the trend and mode of service alarms and identify potential faults or performance deterioration. The alarm cost statistics include the alarm closure rate and automatic alarm handling rate. The O&M supervisor can effectively control the labor cost of changes based on the alarm cost. The alarm quality statistics collects incident ticket- and war room-triggered alarm detection rates, helping O&M supervisors evaluate the validity of current alarms and optimize alarm configurations in a timely manner. For details about the metrics included, see Table 4.
|
Module |
Metric |
Data Source |
Metric Definition |
Calculation Rule |
Statistical Period |
Unit |
|---|---|---|---|---|---|---|
|
Alarm analysis |
Total Alarms |
Alarm management |
Collects the number of alarms in the alarming state. |
Collect the number of alarms within a specified period in the alarming state. |
Day or month |
Count |
|
Alarm Severity |
Alarm management |
Collects the number of alarms of each severity in the alarming state. |
Collect the number of alarms of each severity within a specified period in the alarming state. |
Day or month |
Count |
|
|
Alarm Trend |
Alarm management |
Collects the trend of the number of alarms of each severity within the selected time range. |
Collect the number of alarms of each severity within a selected time range |
Day or month |
Count |
|
|
Alarm Cost |
Alarm Closure Rate |
Alarm management |
Collects statistics on alarm closure. |
Metric value = Number of closed alarms in the selected time range/Total number of alarms × 100% |
Day or month |
% |
|
Automatic Alarm Handling Rate |
Alarm management |
Collects statistics on automatic alarm handling. |
Metric Value = Number of automatically handled alarms in the selected time range/Total number of alarms ×100% |
Day or month |
% |
|
|
Original Alarm > Alarm Quality |
Fault Alarm Detection Rate |
Incident management |
Collects statistics on the number of incident tickets triggered by alarms. |
Metric value = Number of incident tickets converted from alarms in the selected time range/Total number of incident tickets in the selected time range × 100% |
Day or month |
% |
|
WarRoom Alarm Detection Rate |
War rooms |
Collects the number of war rooms triggered by alarms. |
Metric value = Number of war rooms triggered by incidents converted from alarms in the selected time range/Total number of war rooms × 100% |
Day or month |
% |
|
|
Aggregated Alarms > Alarm SLA |
Alarm SLA Fulfillment Rate |
SLA management |
Collects statistics on the SLA fulfillment status of aggregated alarms. |
Metric value = Number of alarm tickets that do not violate the SLA/Total number of alarm tickets included in the statistics × 100% |
Day or month |
% |

For the Total Alarms metric, the bubbles on the page indicate the applications with top alarms of each severity. Top 1 is critical alarms, top 5 is major alarms, top 10 is minor alarms, and another top 10 is warning alarms.
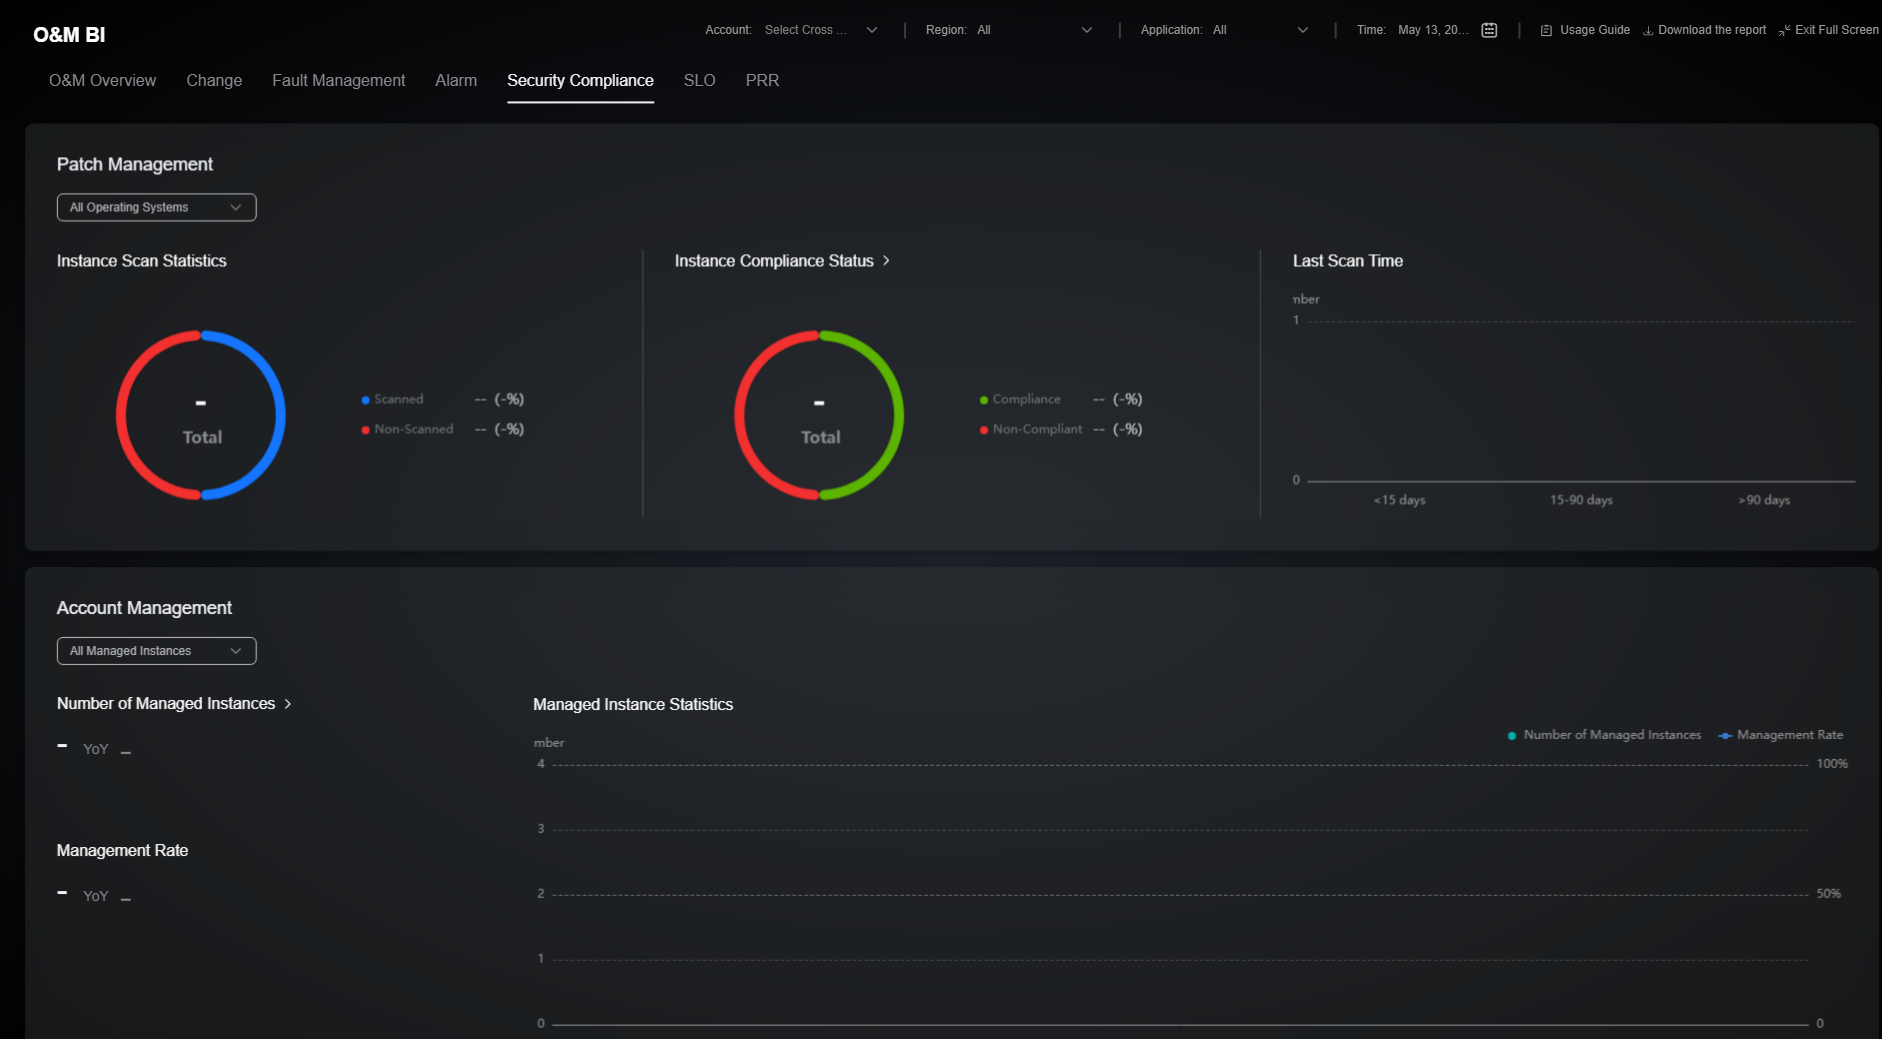
The Security Compliance page consists of statistics on scanned patches and account management. Patch scanning allows you to view instance compliance data by region, application, and OS, and display the number of scanned instances by time range.
|
Module |
Metric |
Data Source |
Metric Definition |
Calculation Rule |
Statistical Period |
Unit |
|---|---|---|---|---|---|---|
|
Patch Management |
Instances Scan Statistics |
Patch management/CloudCMDB |
Collect the number of ECSs where patches have been scanned and have not been scanned under a tenant account. |
The number of unscanned instances is the total number of instances minus the number of scanned instances. |
Area and application |
Count |
|
Instance Compliance Status |
Patch management |
Collect the number of compliant and non-compliant instances in the scanned instances |
Collect the number of instances in each compliance status in patch management. |
Area and application |
Count |
|
|
Last Scan Time |
Patch management |
Collect statistics on the latest scanning time range of scanned instances. |
Collect statistics on the latest scanning time range of scanned instances. |
Area and application |
Count |
|
|
Account Management |
Number of Managed Instances |
Account management |
Collect the number of managed cloud service instances in account management |
Collect the number of managed cloud service instances in account management. |
Area and application |
Count |
|
Management Rate |
Account management |
Collect the proportion of the managed cloud service instances to all instances |
Management rate = Number of managed instances/Total number of instances × 100%. |
Area and application |
% |
|
|
Managed Instance Statistics |
Account management |
Collect the statistics on the instance management trend by time period. |
Collect the statistics on instance management trend by time period. |
Area and application |
- |
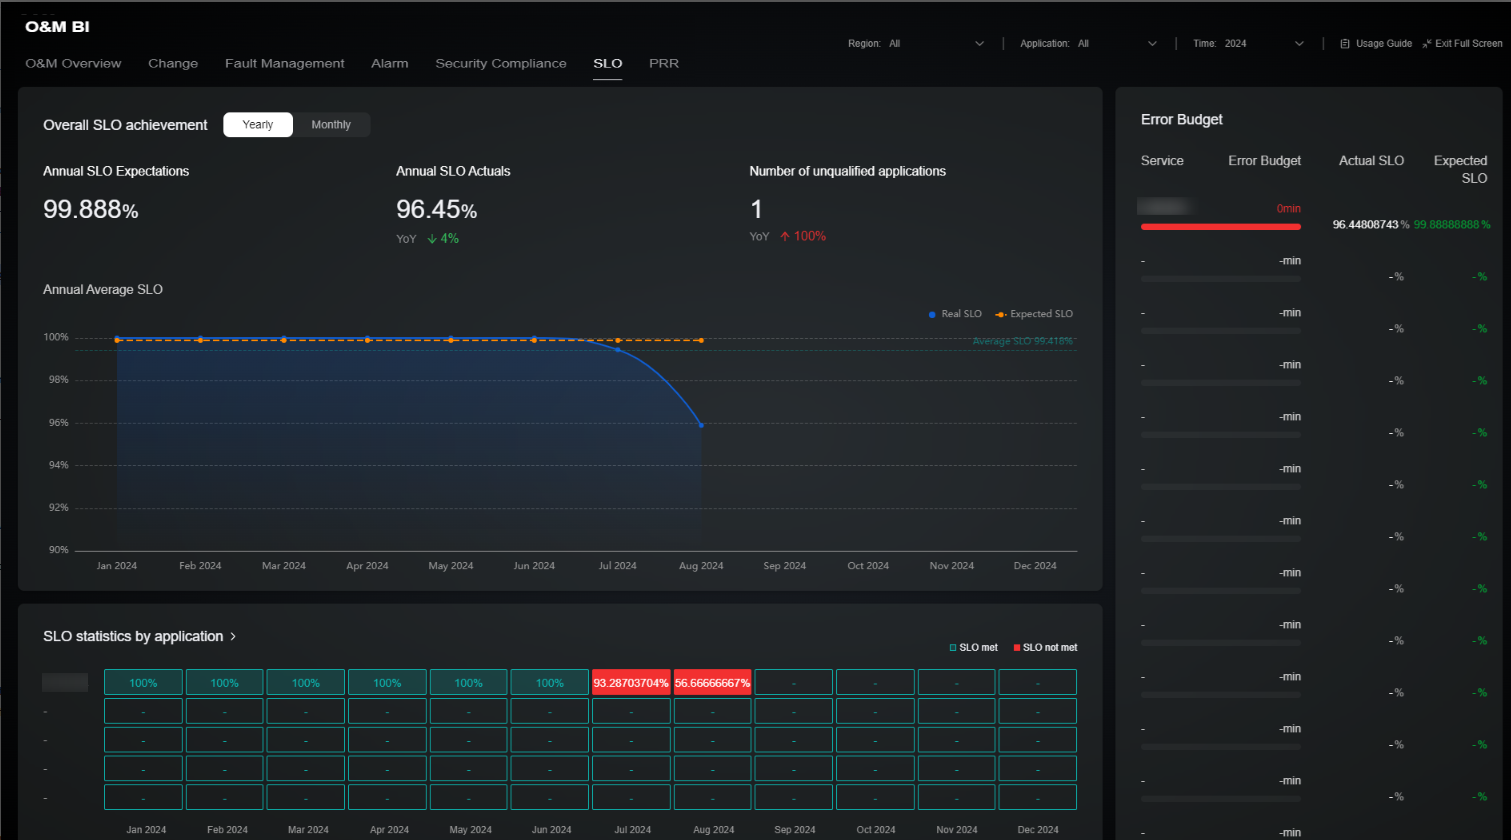
The SLO page covers the overall SLO achievement, SLO statistics by application, and error budget management. The overall SLO achievement area displays average annual and monthly SLO data and the overall SLO trend. The SLO statistics by application area displays SLO values by time and application for you to evaluate the service level of each application. The error budget area shows the error cost calculated on the SLO data of each application for you to evaluate changes or other high-risk operations. For details about the metrics included, see Table 6.
|
Module |
Metric |
Data Source |
Metric Definition |
Calculation Rule |
Statistical Period |
Unit |
|---|---|---|---|---|---|---|
|
Overall SLO Achievement |
Expected Annual SLO |
SLO management |
Collects the expected SLO value of an application in a year. |
Expected SLO value = Expected SLO value set in the SLO management module Expected SLO value of multiple applications = Average expected SLO value of applications |
Year |
% |
|
Annual Actual SLO Value |
SLO management |
Collects the actual SLO achievement of an application in a year. |
Actual SLO value in a year = 1 – (Annual service unavailability duration/Total application duration in a year) × 100% Actual SLO value of multiple applications in a region = Yearly average SLO value of an application in a region Actual SLO value of an application in multiple regions = Yearly minimum SLO value of an application in a region Actual SLO value of multiple applications in multiple regions = Average actual SLO value of an application in multiple regions |
Day or month |
% |
|
|
Non-compliant Applications |
SLO management |
Collects the number of applications that do not meet SLO expectations. |
Calculate the number of applications that fail to achieve the SLO expectation. If all regions are selected and the actual SLO value of applications in any region in a year is less than the annual expected SLO value, the SLO exception is not met. |
Day or month |
Count |
|
|
Expected Monthly SLO |
SLO management |
Collects the expected SLO achievement of an application in a month. |
Expected SLO value = Expected SLO value set in the SLO management module Expected SLO value of multiple applications = Average expected SLO value of applications |
Day or month |
% |
|
|
Actual Monthly SLO |
SLO management |
Collects the actual SLO achievement in a month. |
Actual SLO value in a month = 1 – (Monthly service unavailability duration/Total service duration in a month) × 100% Actual SLO value of multiple applications in a region = Monthly average SLO value of an application in a region Actual SLO value of an application in several regions = Monthly minimum SLO value of an application in a region Actual SLO value of multiple applications in multiple regions = Average actual SLO value of an application in multiple regions |
Day or month |
% |
|
|
SLO Statistics by Application |
SLO Statistics by Application |
SLO management |
Collects SLO statistics by application. |
Collect the monthly SLO actual value by application. Actual SLO value in a month = 1 – (Monthly service unavailability duration/Total service duration in a month) × 100% Actual SLO value of an application in several regions = Monthly minimum SLO value of an application in a region |
Day or month |
% |
|
Error Budget |
Error Budget |
SLO management |
Measures the difference between the actual performance and the expected performance and provides the error budgets. |
If the actual SLO value is greater than the expected SLO value: Error budgets = (Actual annual SLO value – Expected annual SLO value) × Total service duration in a year (minutes) If the actual SLO value is less than or equal to the expected SLO value, the error budget is 0. |
Day or month |
Minute |
Click any metric in the SLO Statistics by Application area. The Real-Time Application SLI Statistics page is displayed.
Only interruption records of the request and instance types can be displayed on the current page.
|
Metric Type |
Metric Name |
Data Source |
Metric Definition |
Calculation Rule |
Statistical Period |
Measurement Unit |
|---|---|---|---|---|---|---|
|
Request-based SLI |
User-defined |
SLO management |
Collects statistics on completion statuses of the requests that are sent to applications. |
You can configure unavailability definition and interruption records. Actual unavailability = Total interruption duration of the metric/Total duration of the year x 100% |
Monthly/Annually |
Percentage |
|
Instance-based SLI |
User-defined |
SLO management |
Collects statistics on the availability of instances that host applications. |
You can configure unavailability definition and interruption records. Actual unavailability = Total interruption duration of the metric/Total duration of the year x 100% |
Monthly/Annually |
Percentage |
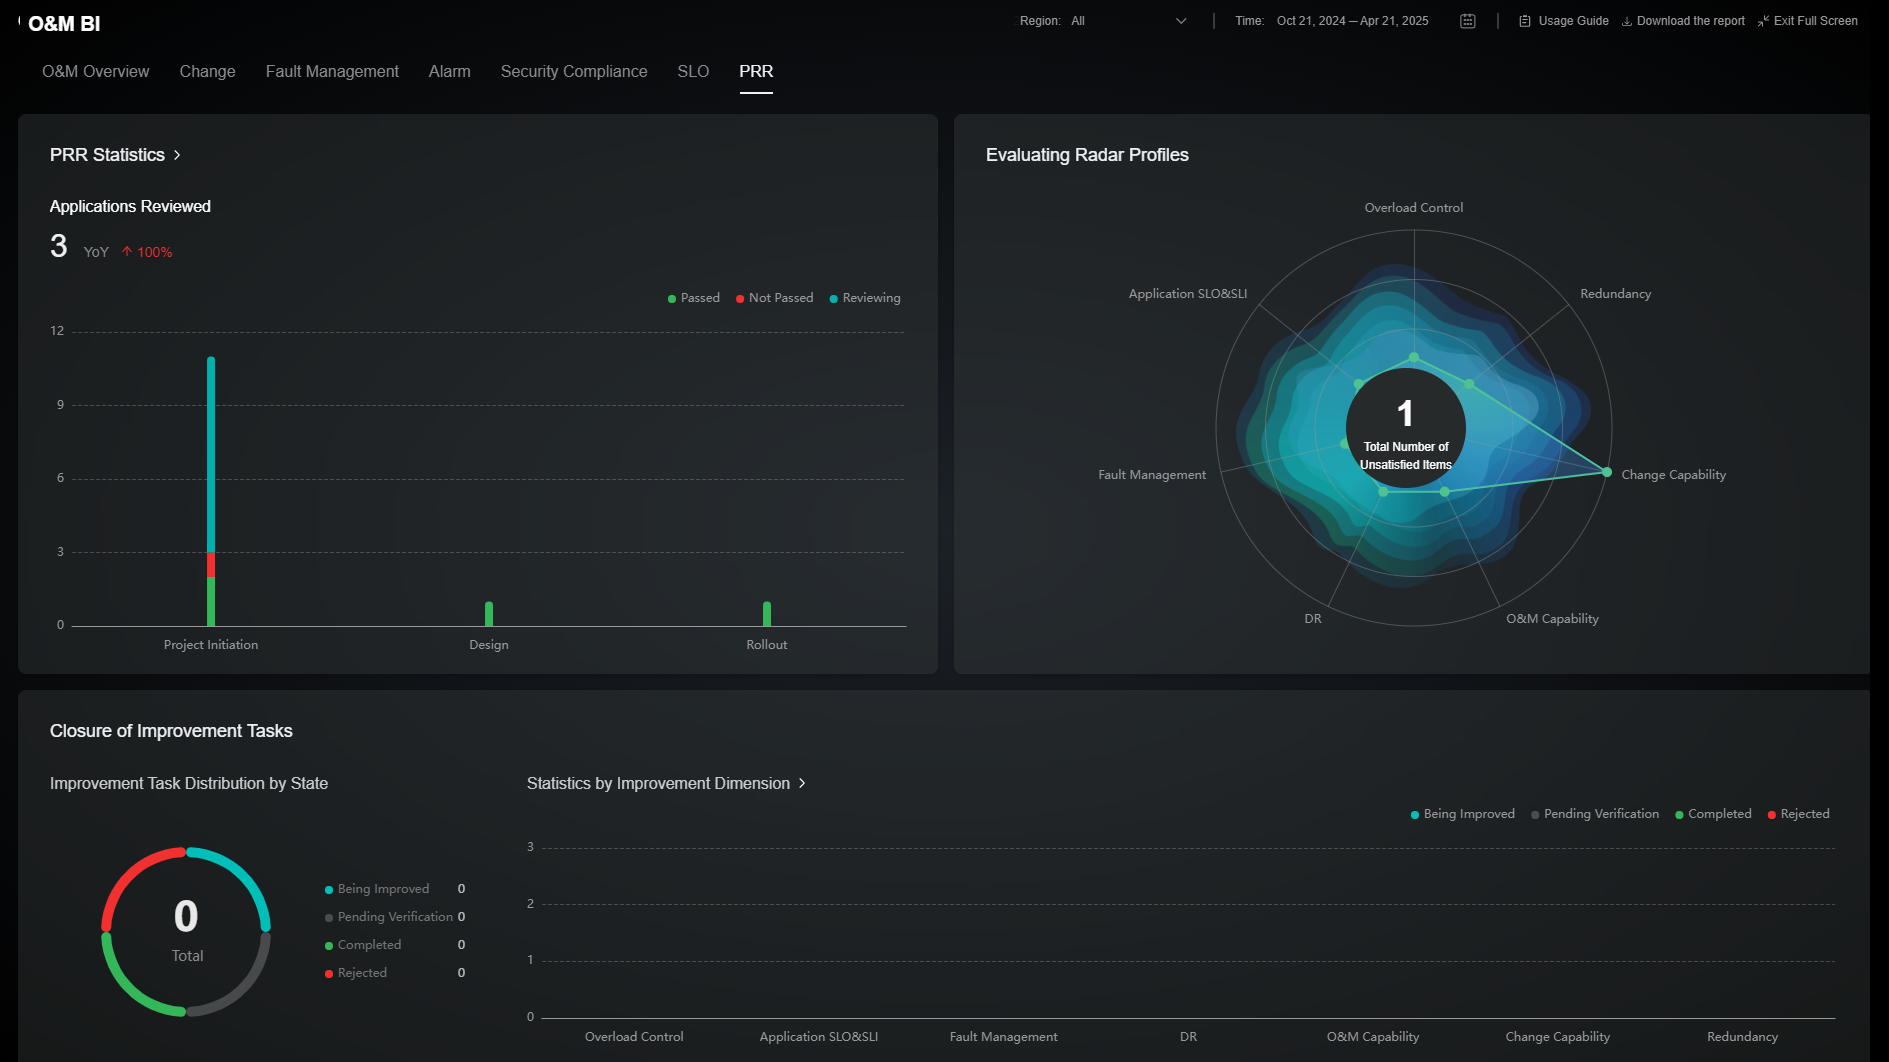
The PRR page consists of PRR statistics, evaluation radar profiles, and improvement task closure. The PRR statistics area shows the review phase of each service before the service is put into production and the review status. The evaluation radar profiles area shows the distribution of review items that do not meet service requirements. The improvement task closure area presents the rectification statuses of the items that do not meet the review requirements. For details about the metrics included, see Table 8.
|
Module |
Metric |
Data Source |
Metric Definition |
Calculation Rule |
Statistical Period |
Unit |
|---|---|---|---|---|---|---|
|
PRR Statistics |
Services Reviewed |
PRR |
Collects the number of services that are covered by the PRR. |
Collect the total number of services are covered by the PRR within a selected time range. (Deduplicated services are excluded.) |
Day or month |
Count |
|
Applications Reviewed |
PRR |
Collects the number of applications that are included in each PRR phase and the approval status. |
Collect the number of applications included in each PRR phase and the review status within a selected time range. (Deduplicated applications are collected.) |
Day or month |
Count |
|
|
Evaluation Radar Profiles |
Evaluation Radar Profiles |
PRR |
Collects the distribution of PRR items that fail to be met. Currently, only the check items in the system template can be displayed. |
Collect the number of review items that are not met in a selected time range. |
Day or month |
Count |
|
Closure of Improvement Tasks |
Improvement Task Distribution by Status |
PRR |
Collects the number of improvement tasks and their statuses. |
Collect the number of improvement tasks and the statuses of the tasks within a selected time range. |
Day or month |
Count |
|
Improvement Tasks |
PRR |
Collects the number of improvement tasks in each dimension and their closure statuses. |
Collect the number of improvement tasks by review item and the statuses of these tasks. |
Day or month |
Count |
Feedback
Was this page helpful?
Provide feedbackThank you very much for your feedback. We will continue working to improve the documentation.See the reply and handling status in My Cloud VOC.
For any further questions, feel free to contact us through the chatbot.
Chatbot


