Dashboard
There are two types of Dashboard pages, Dashboard Without Cluster Overview and Dashboard With Cluster Overview. The dashboard page displayed on your console is determined by whether you have purchased any cluster or not.
Dashboard Without Cluster Overview
The dashboard page consists of the following modules:
- Process
This module describes how to create a cluster, connect to a cluster, and import sample data from OBS to GaussDB(DWS). You can click Learn more to check more information.
Figure 1 Process
- Features
This module describes multiple powerful functions of GaussDB(DWS), including SQL compatibility, cluster snapshot, cluster disaster recovery, database monitoring, resource management, and online O&M. You can quickly learn how they work and use them as required.
Figure 2 Features
Dashboard With Cluster Overview
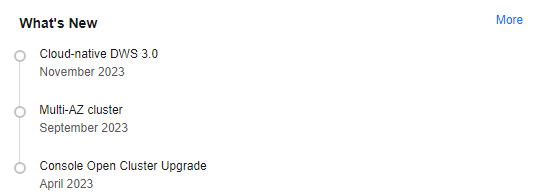
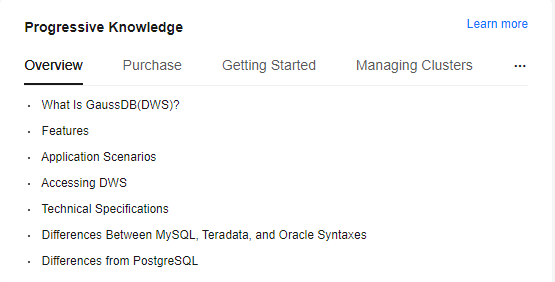
The dashboard page contains Progressive Knowledge, What's New, Features, and the following modules:
- Resources
In the Resources module, you can view the number of available resources, including Available/Total Clusters, Available/Total Nodes, and Total Capacity.
Figure 5 Resources
- Alarms
Alarms are classified by severity: Urgent, Important, Minor, Prompt. For details, see Alarms.
Figure 6 Alarms
- Recent Events
Events are change records of user cluster status. Events can be triggered by user operations or cluster status changes. For details, see Event Notifications.
Figure 7 Recent events
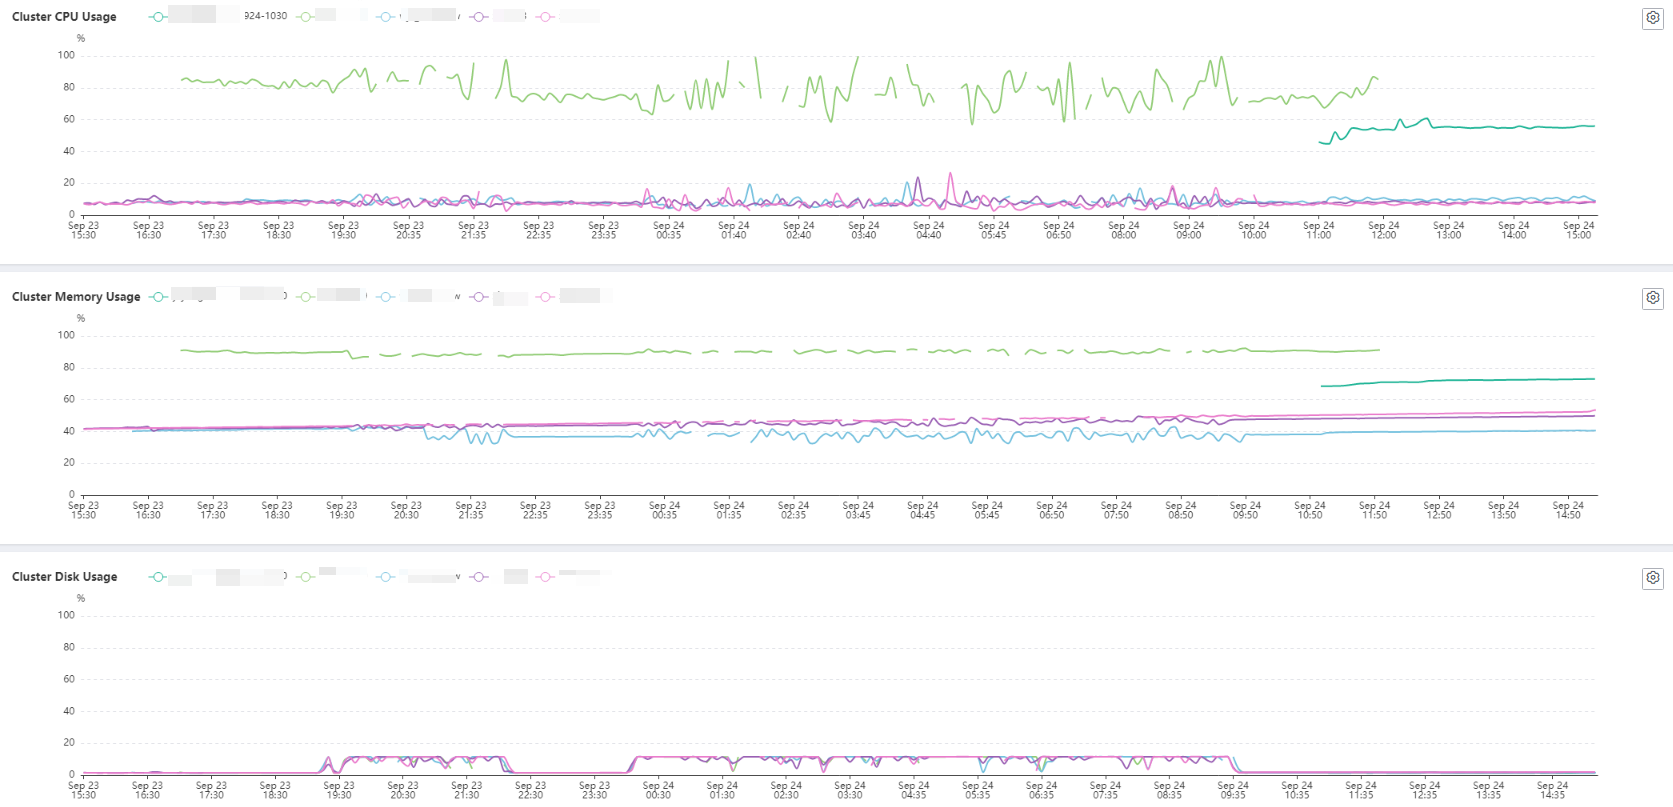
- Main cluster metrics:
- Cluster CPU Usage
- Cluster Memory Usage
- Cluster Disk Usage
Figure 8 Main cluster metrics

- For details about Progressive Knowledge, see Progressive Knowledge.
- For details about product changes, see What' New.
- For details about GaussDB(DWS) features, see Features.
Feedback
Was this page helpful?
Provide feedbackThank you very much for your feedback. We will continue working to improve the documentation.See the reply and handling status in My Cloud VOC.
For any further questions, feel free to contact us through the chatbot.
Chatbot


