Querying Product Sales Data Using the Intelligent Analysis Assistant
DataArts Insight supports intelligent Q&A through natural language interaction, allowing you to obtain data results directly and achieve instant data responses. This section uses the sales data of a specific product category as an example to illustrate how to use the intelligent analysis assistant to quickly obtain data results and related charts.
Data Description
This example includes the following data tables: lineorder (order table), customer (customer information table), part (product information table), and date (date information table).
|
Table Name |
Field |
Description |
Type |
|---|---|---|---|
|
lineorder |
lo_orderpriority |
Order priority |
Dimension |
|
lo_shipmode |
Shipping mode |
Dimension |
|
|
lo_commitdate |
Commitment date |
Dimension |
|
|
lo_linenumber |
Line number |
Dimension |
|
|
lo_orderdate |
Order date |
Dimension |
|
|
lo_quantity |
Quantity |
Metric |
|
|
lo_ordtotalprice |
Total order price |
Metric |
|
|
lo_discount |
Discount |
Metric |
|
|
lo_revenue |
Revenue |
Metric |
|
|
lo_supplycost |
Supply cost |
Metric |
|
|
lo_tax |
Tax |
Metric |
|
|
customer |
c_name |
Customer name |
Dimension |
|
c_address |
Customer address |
Dimension |
|
|
c_city |
Customer city |
Dimension |
|
|
c_nation |
Customer country |
Dimension |
|
|
c_region |
Customer continent |
Dimension |
|
|
c_phone |
Customer phone |
Dimension |
|
|
s_name |
Supplier name |
Dimension |
|
|
s_address |
Supplier address |
Dimension |
|
|
s_city |
Supplier city |
Dimension |
|
|
s_nation |
Supplier country |
Dimension |
|
|
s_region |
Supplier continent |
Dimension |
|
|
s_phone |
Supplier phone |
Dimension |
|
|
part |
p_name |
Product name |
Dimension |
|
p_category |
Product category |
Dimension |
|
|
p_brand |
Product brand |
Dimension |
|
|
p_type |
Product specifications |
Dimension |
|
|
p_container |
Packing |
Dimension |
|
|
p_size |
Size |
Metric |
|
|
date |
d_dayofweek |
Day of the week |
Dimension |
|
d_month |
Month |
Dimension |
|
|
d_sellingseason |
Season |
Dimension |
|
|
d_holidayfl |
Holiday |
Dimension |
|
|
d_lastdayinweekfl |
Weekend |
Dimension |
|
|
d_lastdayinmonthfl |
End of month |
Dimension |
Step 1: Upload a Data File
- Log in to the DataArts Insight console.
- Click
 in the upper left corner of the management console to select a region and select an enterprise project from Enterprise Project in the lower left corner of the Workspace page.
 - Click the name of the desired project in the My Projects area in the right pane.
- In the navigation pane on the left, choose Data Management > Data Sources.
- Click
 next to the data source name and select Uploaded Files (Figure 1). Select the Excel file you want to upload, modify parameters as required, and click OK. Repeat this step to upload all data tables in sequence. For details about the data table, see Data Description.

Before uploading files, you need to configure the data storage bucket on the System Settings > OBS Bucket Settings page.
Step 2: Create a Dataset
- Choose Data Management > Datasets. On the displayed page, click Create Dataset.
- Under My Data Sources, select a data source. Click the Uploaded Files and double-click or drag the data table uploaded in Step 1: Upload a Data File to add it to the operation panel.
Figure 2 Selecting a data table
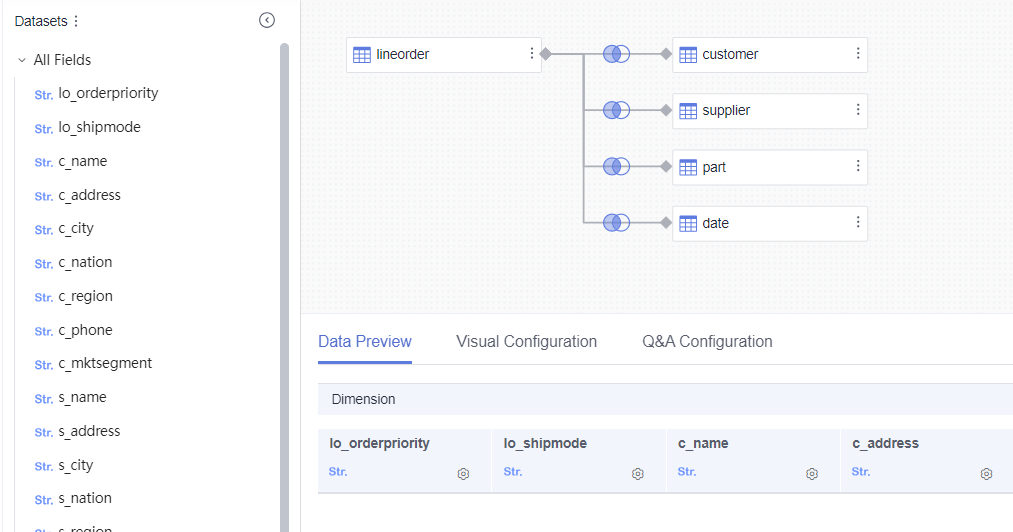
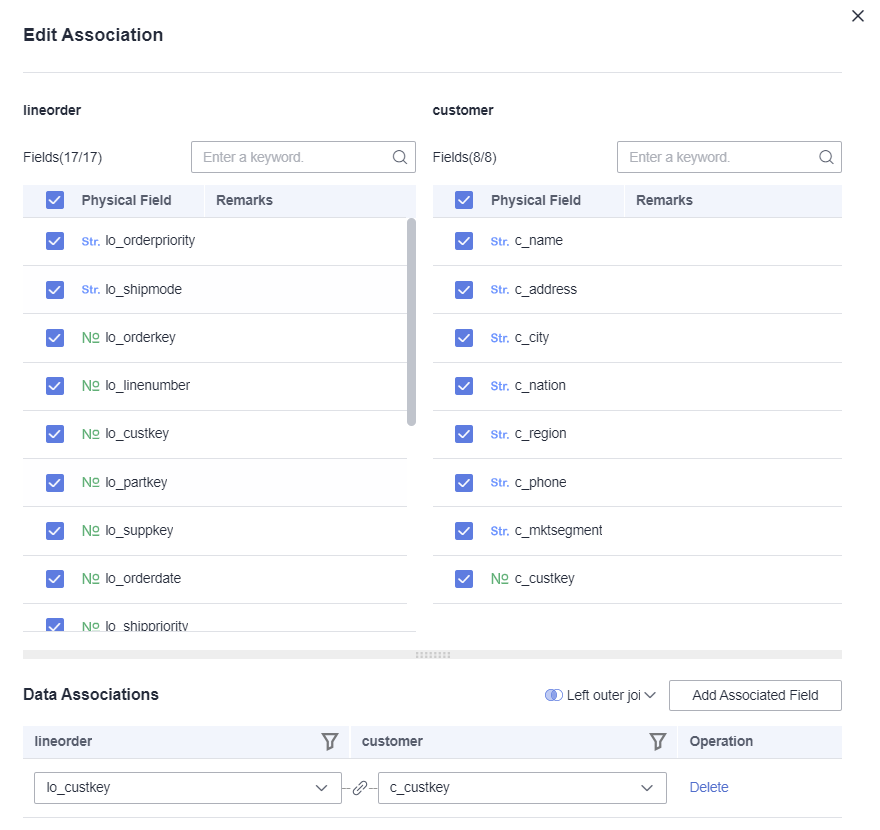
- Set the association between data tables (Figure 3). In this example, the different tables are connected by the left outer join, and the connection fields are as follows:
- lineorder.lo_custkey = customer.c_custkey
- lineorder.lo_suppkey = supplier.s_suppkey
- lineorder.lo_partkey = part.p_partkey
- lineorder.lo_orderdate = dates.d_datekey
Step 3: Configure the Dataset
- Click the Visual Configuration tab and set the meaning of the field names. For the field meaning in this example, see the description in Table 1. Once configured, it will help analysts understand and improve the Q&A accuracy of the intelligent analysis assistant.
Figure 4 Visual configuration

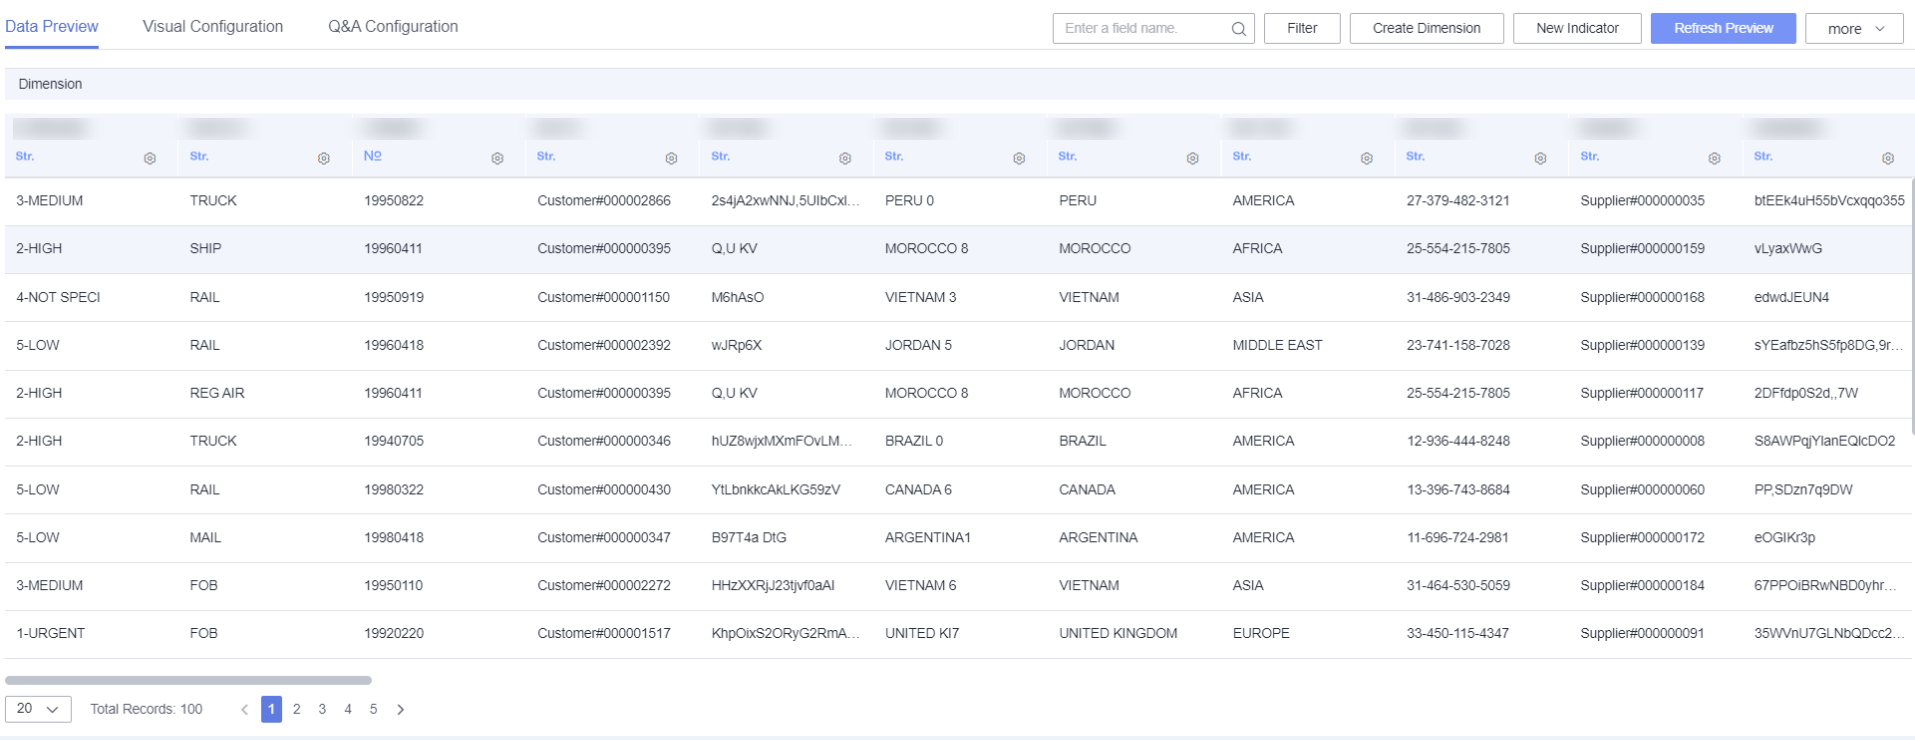
- Click the Data Preview tab and then Refresh Preview to view basic information about the dataset.
Figure 5 Data Preview tab
- Confirm the information and click Save.
Step 4: Create an Indicator
- In the navigation pane on the left, choose Data Management > Indicator. On the displayed page, click Create Indicator.
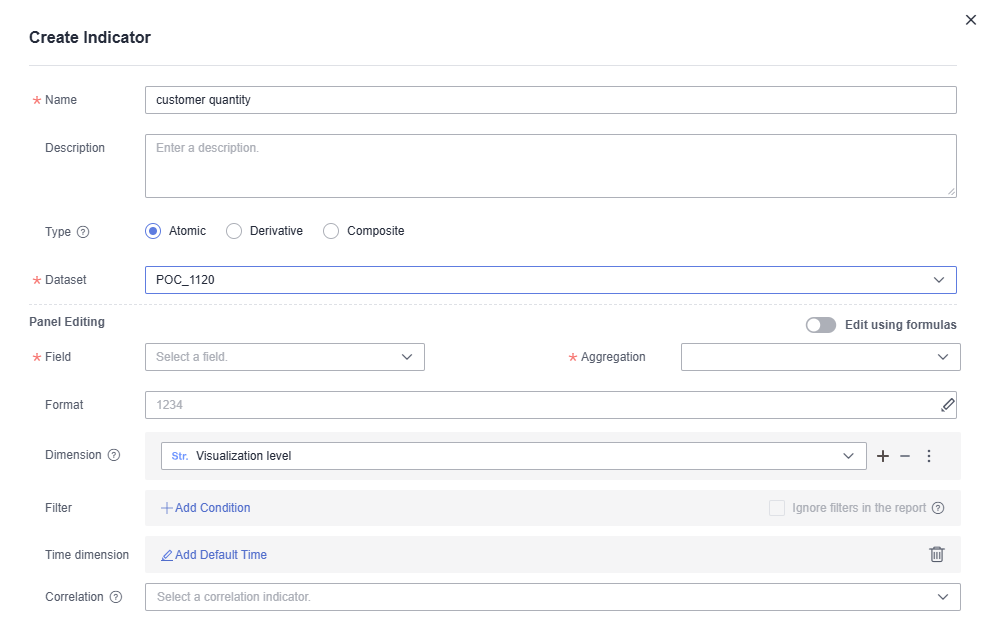
- Create four indicators by setting the parameters based on Table 2.
Figure 6 Creating a customer quantity indicator
|
Indicator Name |
Indicator Type |
Parameter Settings |
|---|---|---|
|
customer quantity |
Atomic |
Field: customer name Aggregation: deduplication Dimension: order time |
|
total order amount |
Atomic |
Field: total order price Aggregation: sum Dimension: order time |
|
pop customer quantity |
Derivative |
Atomic: customer quantity Derivative: YoY and PoP growth rate Comparison: month-over-month growth |
|
Customer unit price |
Composite |
[Total order amount]/[Customer quantity] |
Step 5: Create an Intelligent Analysis Assistant
- In the navigation pane on the left, choose Data Analytics > Intelligent Analysis Assistants.
- Click Create Domain. In the dialog box that appears (Figure 7), enter a name and select an associated dataset.
- Click OK.
- In the list, locate the intelligent analysis assistant you created, and click Train in the Operation column. If Training Status is Successful, as shown in Figure 8, the intelligent analysis assistant is successfully trained.
Step 6: Use the Intelligent Analysis Assistant for Q&A
- In the navigation pane on the left, choose Data Analytics > Intelligent Analysis Assistants.
- Locate the intelligent analysis assistant you trained and click Q&A in the Operation column.
- Enter questions on the Q&A page. This example lists two sample questions. For more sample questions, refer to Table 3.
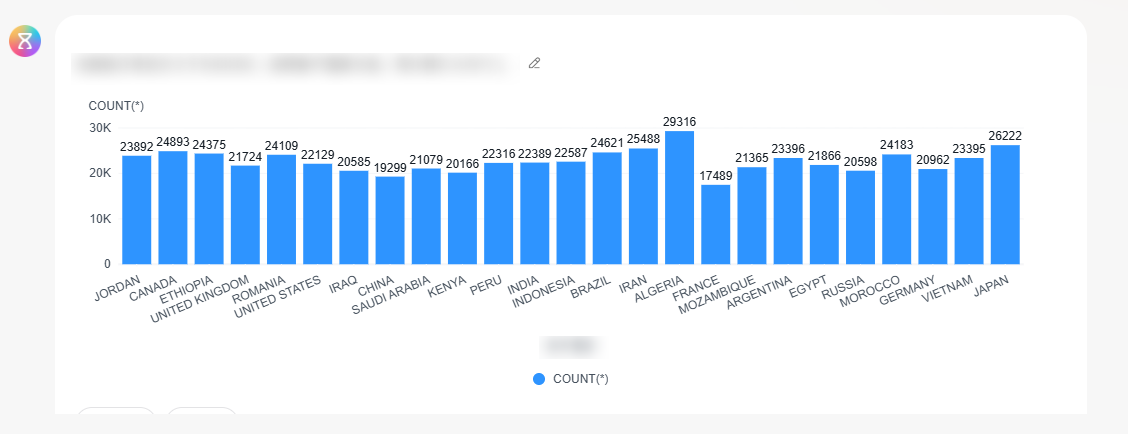
- Sample question 1: Find the number of orders with a total price higher than 5 million in each customer's country.
Figure 9 Result for sample question 1
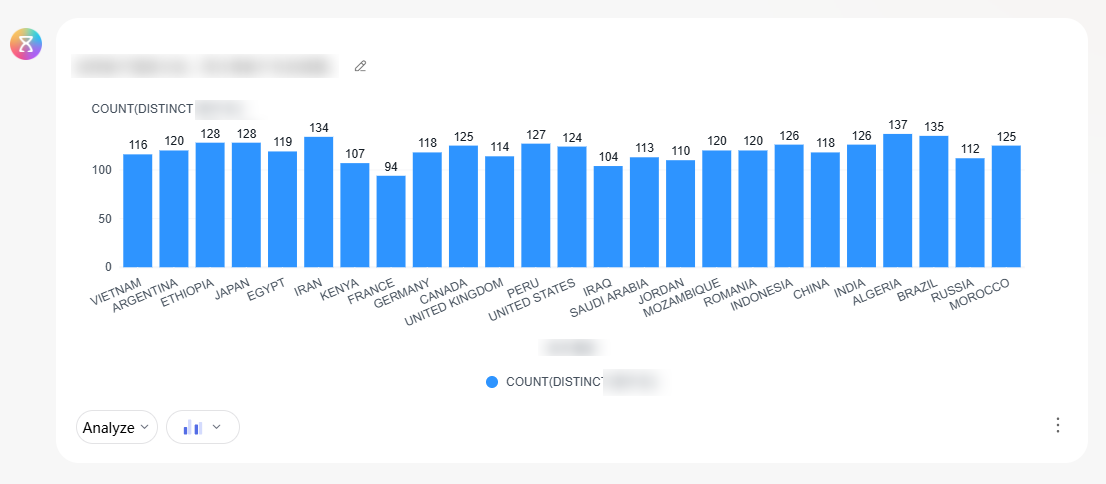
- Sample question 2: Check the number of customers in different countries.
Figure 10 Result for sample question 2
- Sample question 1: Find the number of orders with a total price higher than 5 million in each customer's country.
|
No. |
Question |
|---|---|
|
1 |
Find the number of orders with a total price higher than 5 million in each customer's country. |
|
2 |
What is the average total price of customer orders with discounts between 10% and 30%? |
|
3 |
Total number of major trouble tickets created in each project in 2023 (field status: major, minor). |
|
4 |
Total number of reliability issues created in each project in 2023 (field category: reliability issues, security issues). |
|
5 |
Query the sales of each project this year. |
|
6 |
Query the sales for May 2023. |
|
7 |
Total price of high-priority orders for railway shipments in May 1992. |
|
8 |
Check the number of customers in different countries. |
|
9 |
Query the total number of products supplied by different suppliers. |
|
10 |
Count the number of customers per month in 1992. |
|
11 |
Monthly comparison of customer numbers in different countries in 1992. |
|
12 |
Query the trend of total credit card spending each month. |
|
13 |
Query the total spending for each quarter. |
|
14 |
Query the total spending for different categories of products. |
|
15 |
Count the total spending by region and product category. |
|
16 |
Display the merchant number and manager number for all active merchants. |
|
17 |
Query the merchant number and loan amount for active merchants. |
|
18 |
Sort customer information by descending order of revenue. |
|
19 |
Query the country with the lowest total revenue. |
|
20 |
Top 10 suppliers by supply cost in Asia. |
Feedback
Was this page helpful?
Provide feedbackThank you very much for your feedback. We will continue working to improve the documentation.See the reply and handling status in My Cloud VOC.
For any further questions, feel free to contact us through the chatbot.
Chatbot


