
Developing a Large Screen for Visit Statistics
Scenario
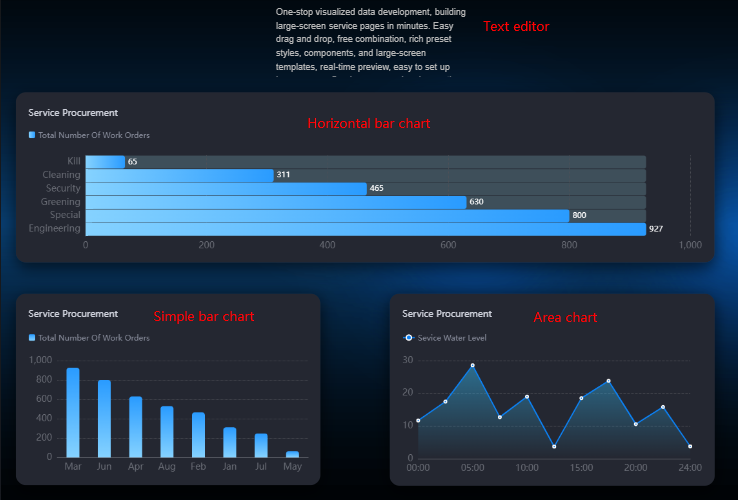
The visit statistics screen shows campus personnel data, such as type, traffic, and total count, as shown in Figure 1.
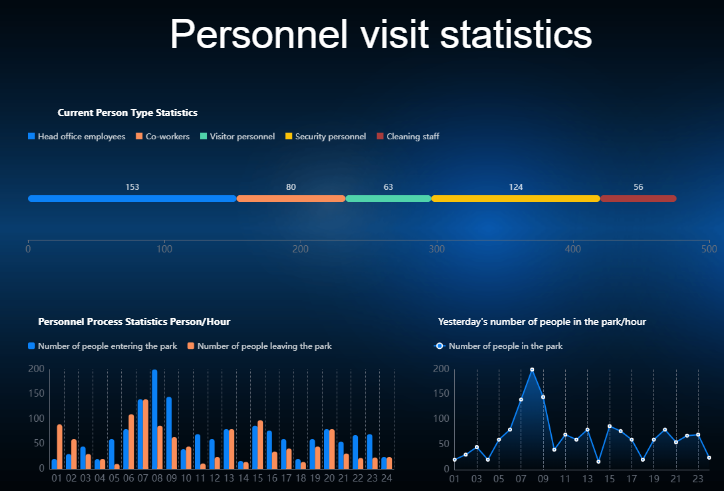
Figure 1 displays the used widgets, from left to right and from top to bottom.
|
Widget |
Description |
|---|---|
|
Text editor |
Displays titles such as personnel visit statistics. |
|
Horizontal bar chart |
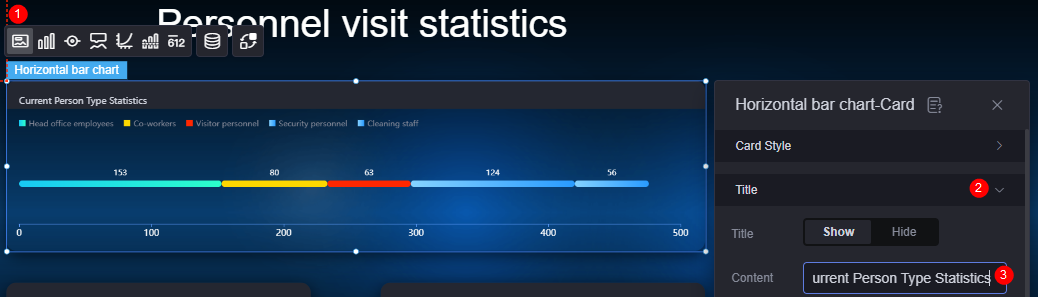
Collects statistics on the current personnel type, such as head office employees, partner employees, visitors, security personnel, and cleaning personnel. |
|
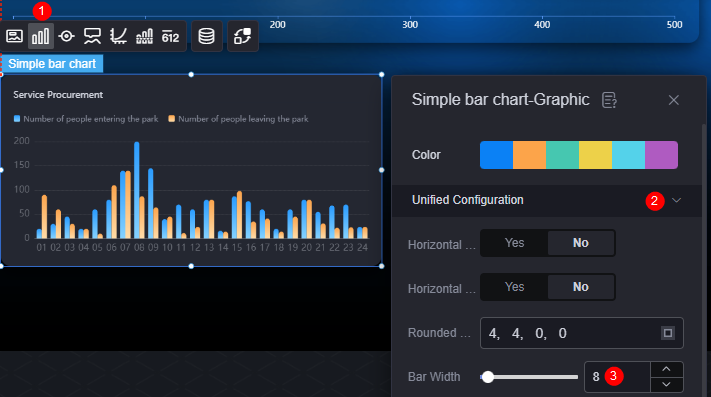
Bar chart |
Collects statistics on the number of people entering and leaving the campus. |
|
Area line chart |
Collects statistics on the number of people in the campus yesterday. |
Developing a Large Screen Page
- Log in to the Huawei Cloud Astro Canvas console and click Go to Homepage.
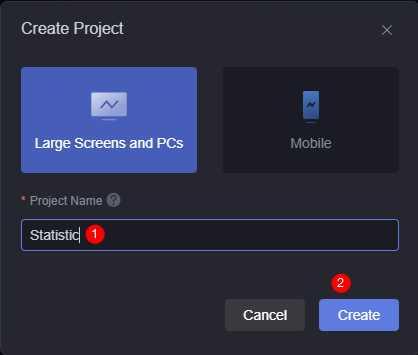
- Create a project for Large Screens and PCs, set Project Name to "Statistics", and click Create.
Figure 2 Creating a project
- In the large screen and PC project, click Create and click New Empty Page.
- Enter the page title "Personnel Visit Statistics" and click Create.
A page title can contain 1 to 100 characters. You can adjust the page resolution and widget layout to achieve the optimal display effect.
- Click
 in the upper part of the page and set the background image as required.
Figure 3 Setting the background image
in the upper part of the page and set the background image as required.
Figure 3 Setting the background image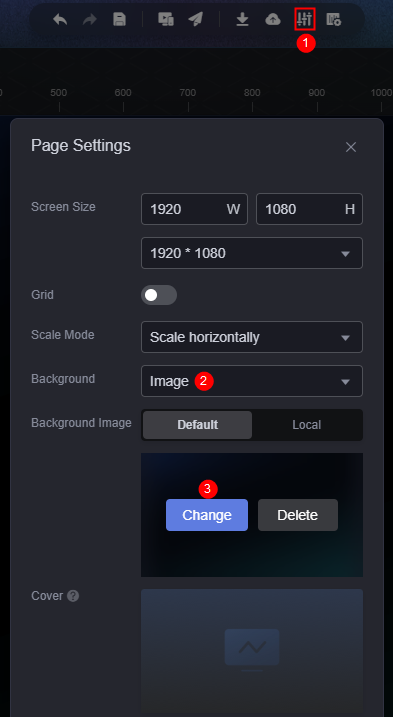 Figure 4 Setting the background image
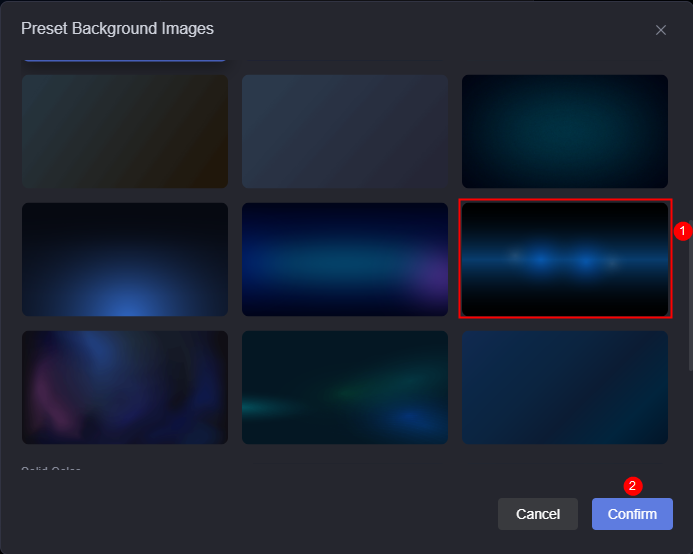
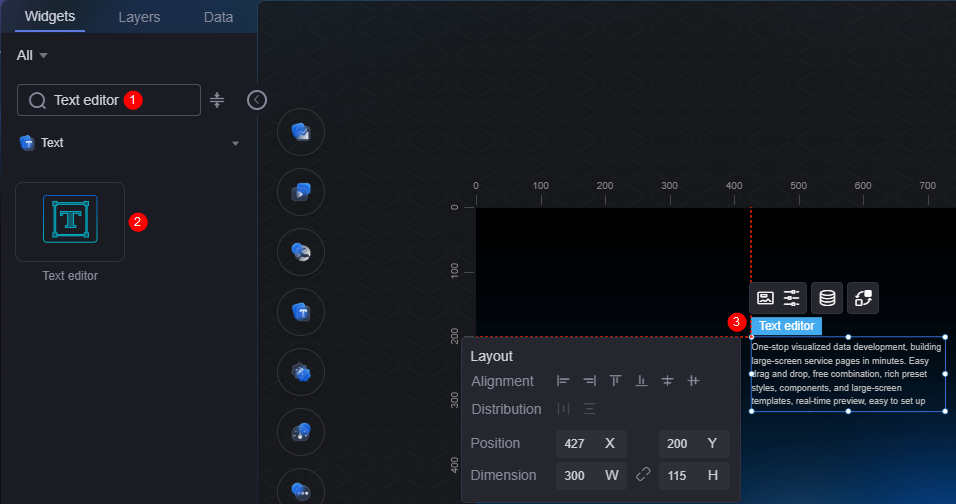
- Drag a text editor widget, a horizontal bar chart widget, a bar chart widget, and an area line chart widget to the canvas, as shown in Figure 6.
Figure 5 Dragging a text editor widget to the canvas
- In the upper right corner of the page, select a theme as required. (In this example, the original theme is used by clicking Clear.)
- Configure the text editor widget.
- Select the text editor widget, click
 , set the text content to "Personnel Visit Statistics", and set the font to 60.
Figure 7 Setting the text title
, set the text content to "Personnel Visit Statistics", and set the font to 60.
Figure 7 Setting the text title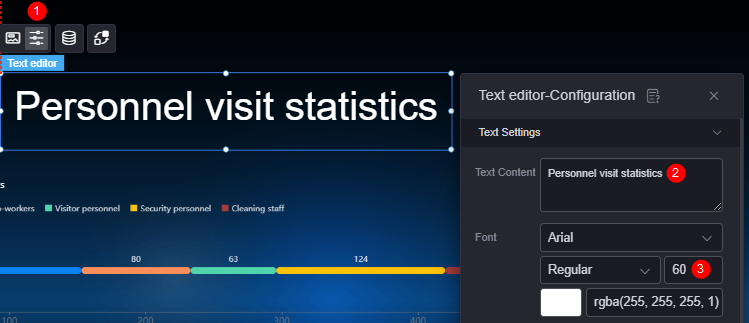
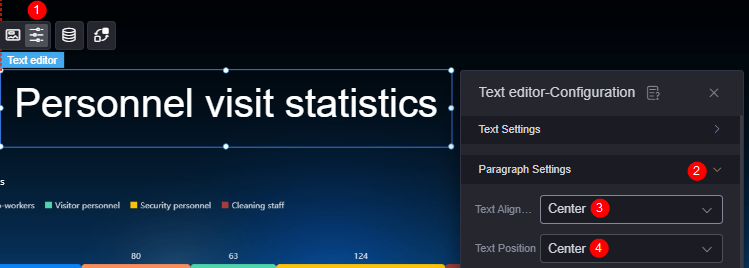
- In the paragraph settings area, set the title alignment to center.
Figure 8 Setting the title alignment
- Select the text editor widget, click
- Configure the horizontal bar chart widget.
- Select the horizontal bar chart widget, click
 above the widget, configure the widget data, and click the save button.
Set the data type to static data and the input data format to JSON, enter the following example data, and click
 to format the data.
[{ "x": "Personnel Statistics", "y": 153, "s": "Head office employees" }, { "x": "Personnel Statistics", "y": 80, "s": "Partner employees" }, { "x": "Personnel Statistics", "y": 63, "s": "Visitors" }, { "x": "Personnel Statistics", "y": 124, "s": "Security personnel" }, { "x": "Personnel Statistics", "y": 56, "s": "Cleaning personnel" } ] - Select the horizontal bar chart widget, click
 above the widget, and select the Blue Gradient Non-sorting template.
Figure 9 Setting a template
above the widget, and select the Blue Gradient Non-sorting template.
Figure 9 Setting a template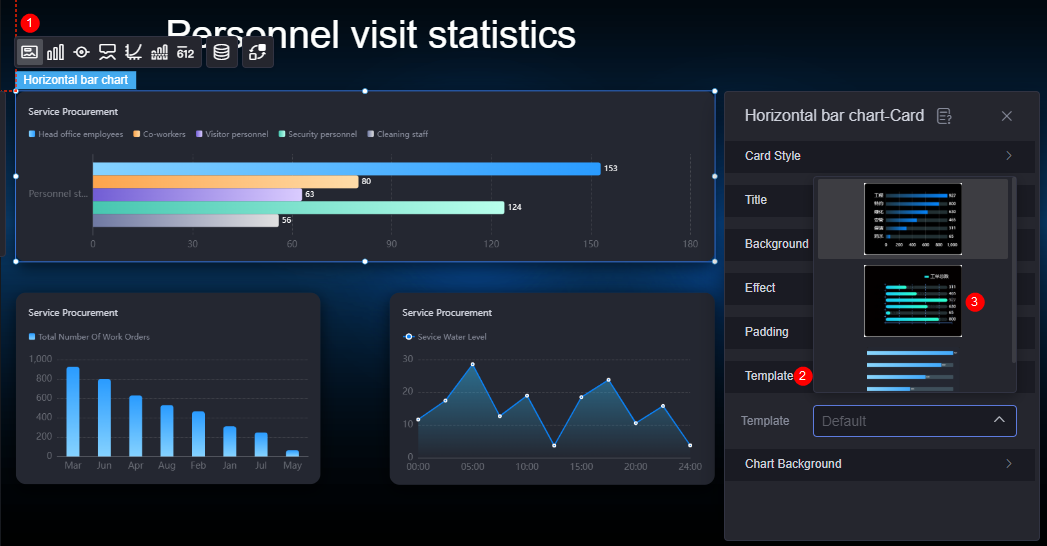
- Select the horizontal bar chart widget, click
 above the widget, and select Show for Data Label of all data series to display data above the bars.
Figure 10 Data displayed above the bars
above the widget, and select Show for Data Label of all data series to display data above the bars.
Figure 10 Data displayed above the bars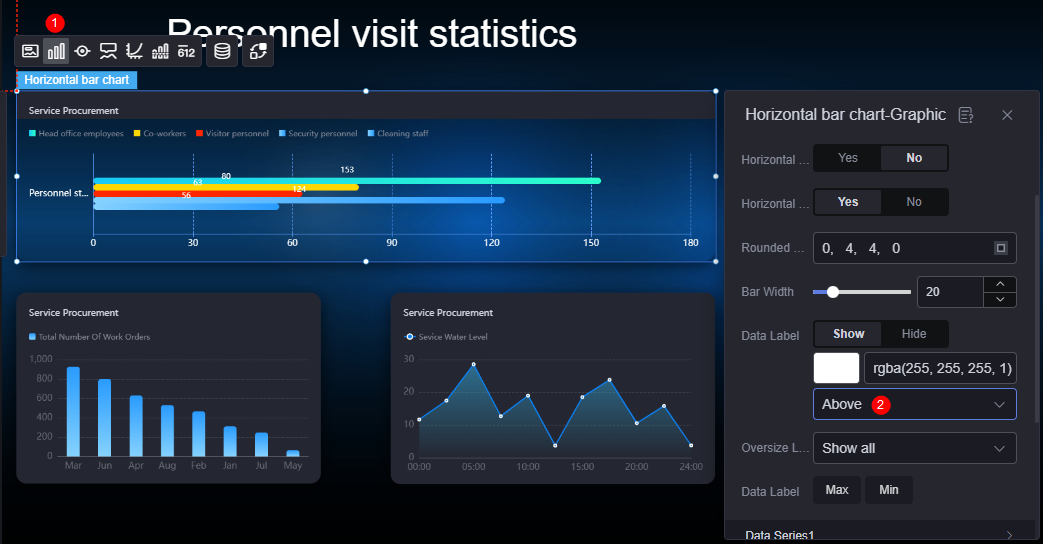
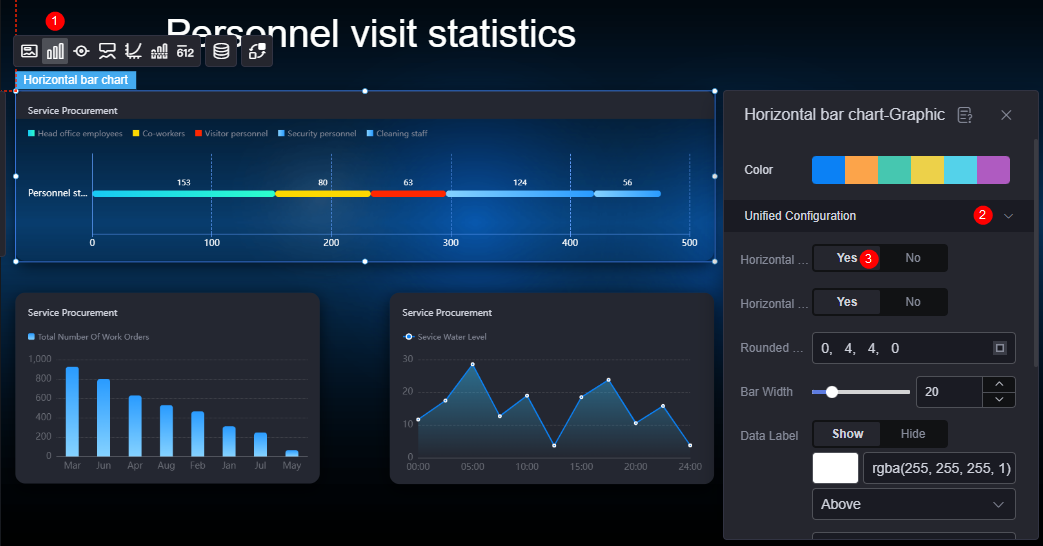
- Enable the horizontal stacking effect.
Figure 11 Enabling the horizontal stack effect
- Select the horizontal bar chart widget and click
 above the widget to hide the X-axis and the Y-axis gridline.
Figure 12 Hiding the X axis
above the widget to hide the X-axis and the Y-axis gridline.
Figure 12 Hiding the X axis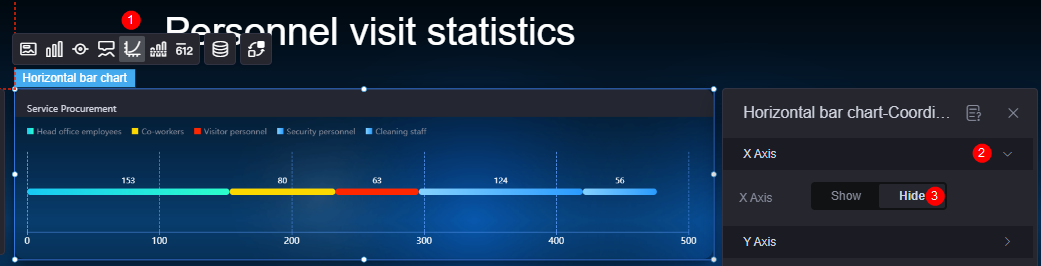 Figure 13 Hiding the Y-axis gridline
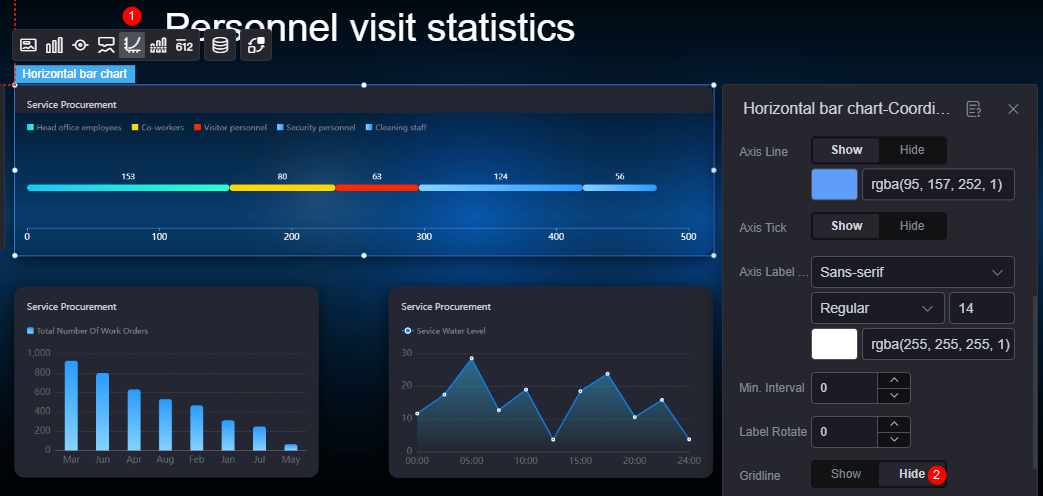
- Select the horizontal bar chart widget, click above the widget, and set the widget title to "Current Person Type Statistics".
Figure 14 Setting the widget title
- Select the horizontal bar chart widget, click
- Configure the bar chart widget in the lower left corner by referring to 9.
- Select the bar chart widget, click above the widget, configure widget data, and click the save button.
Set the data type to static data and the input data format to JSON, enter the following example data, and click
to format the data.[{ "x": "01", "y": 20, "s": "Number of admissions" }, { "x": "02", "y": 30, "s": "Number of admissions" }, { "x": "03", "y": 45, "s": "Number of admissions" }, { "x": "04", "y": 20, "s": "Number of admissions" }, { "x": "05", "y": 60, "s": "Number of admissions" }, { "x": "06", "y": 80, "s": "Number of admissions" }, { "x": "07", "y": 140, "s": "Number of admissions" }, { "x": "08", "y": 200, "s": "Number of admissions" }, { "x": "09", "y": 145, "s": "Number of admissions" }, { "x": "10", "y": 40, "s": "Number of admissions" }, { "x": "11", "y": 70, "s": "Number of admissions" }, { "x": "12", "y": 60, "s": "Number of admissions" }, { "x": "13", "y": 80, "s": "Number of admissions" }, { "x": "14", "y": 16, "s": "Number of admissions" }, { "x": "15", "y": 87, "s": "Number of admissions" }, { "x": "16", "y": 77, "s": "Number of admissions" }, { "x": "17", "y": 60, "s": "Number of admissions" }, { "x": "18", "y": 20, "s": "Number of admissions" }, { "x": "19", "y": 60, "s": "Number of admissions" }, { "x": "20", "y": 80, "s": "Number of admissions" }, { "x": "21", "y": 55, "s": "Number of admissions" }, { "x": "22", "y": 68, "s": "Number of admissions" }, { "x": "23", "y": 70, "s": "Number of admissions" }, { "x": "24", "y": 24, "s": "Number of admissions" }, { "x": "01", "y": 90, "s": "Number of people leaving the park" }, { "x": "02", "y": 60, "s": "Number of people leaving the park" }, { "x": "03", "y": 30, "s": "Number of people leaving the park" }, { "x": "04", "y": 20, "s": "Number of people leaving the park" }, { "x": "05", "y": 10, "s": "Number of people leaving the park" }, { "x": "06", "y": 110, "s": "Number of people leaving the park" }, { "x": "07", "y": 140, "s": "Number of people leaving the park" }, { "x": "08", "y": 87, "s": "Number of people leaving the park" }, { "x": "09", "y": 64, "s": "Number of people leaving the park" }, { "x": "10", "y": 45, "s": "Number of people leaving the park" }, { "x": "11", "y": 11, "s": "Number of people leaving the park" }, { "x": "12", "y": 24, "s": "Number of people leaving the park" }, { "x": "13", "y": 80, "s": "Number of people leaving the park" }, { "x": "14", "y": 14, "s": "Number of people leaving the park" }, { "x": "15", "y": 98, "s": "Number of people leaving the park" }, { "x": "16", "y": 35, "s": "Number of people leaving the park" }, { "x": "17", "y": 41, "s": "Number of people leaving the park" }, { "x": "18", "y": 14, "s": "Number of people leaving the park" }, { "x": "19", "y": 45, "s": "Number of people leaving the park" }, { "x": "20", "y": 80, "s": "Number of people leaving the park" }, { "x": "21", "y": 31, "s": "Number of people leaving the park" }, { "x": "22", "y": 22, "s": "Number of people leaving the park" }, { "x": "23", "y": 23, "s": "Number of people leaving the park" }, { "x": "24", "y": 24, "s": "Number of people leaving the park" } ] - Select the bar chart widget, click above the widget, and set the bar width in the data series to 8 in the unified configuration.
Figure 15 Setting the bar width to 8
- Select the bar chart widget, click above the widget to show the X-axis gridline and the Y-axis, and hide the Y-axis gridline.
Figure 16 Displaying the X-axis gridline
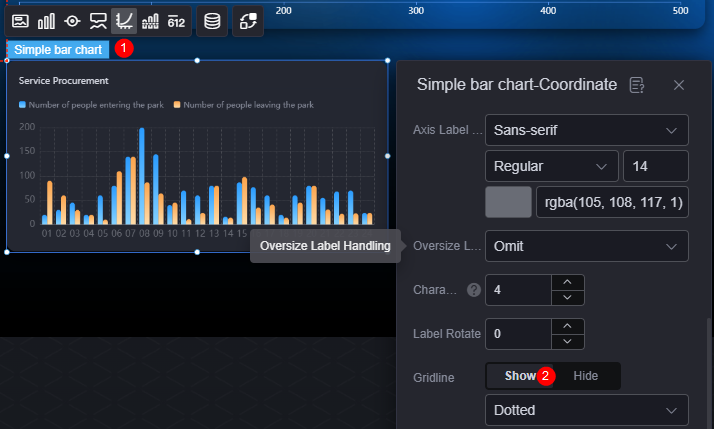 Figure 17 Displaying the Y-axis and hiding the Y-axis gridline
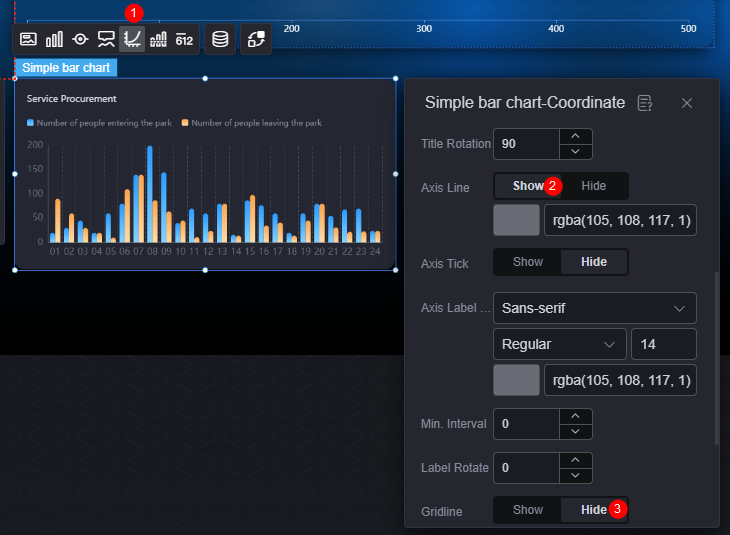
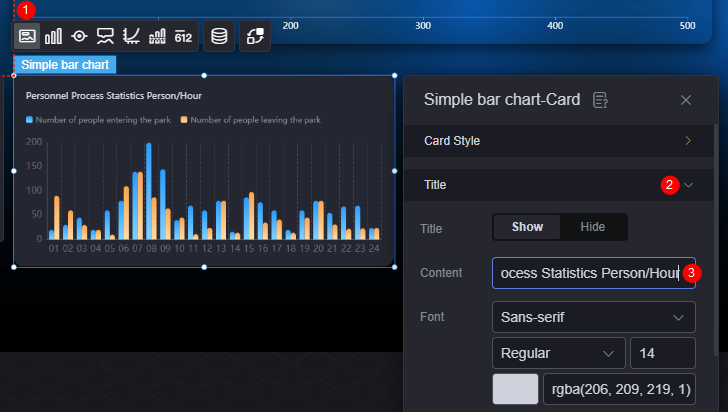
- Select the bar chart widget, click above the widget, and set the title content to "Personnel Process Statistics Person/Hour".
Figure 18 Setting the title
- Select the bar chart widget, click
- Configure the area line chart widget by referring to 9.
- Select the area chart widget, click above the widget, and configure the widget data.
Set the data type to static data and the input data format to JSON, enter the following example data, and click
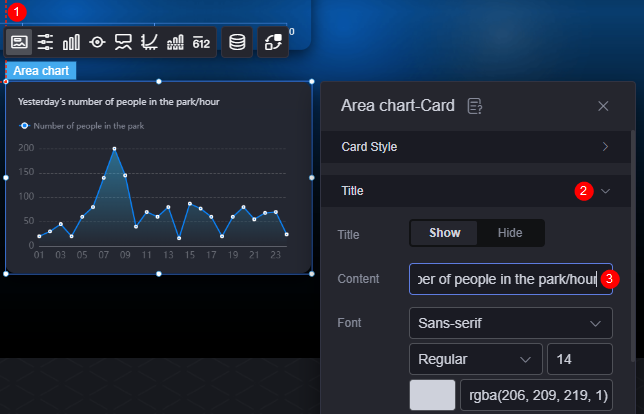
to format the data.[{ "x": "01", "y": 20, "s": "Number of people in the park" }, { "x": "02", "y": 30, "s": "Number of people in the park" }, { "x": "03", "y": 45, "s": "Number of people in the park" }, { "x": "04", "y": 20, "s": "Number of people in the park" }, { "x": "05", "y": 60, "s": "Number of people in the park" }, { "x": "06", "y": 80, "s": "Number of people in the park" }, { "x": "07", "y": 140, "s": "Number of people in the park" }, { "x": "08", "y": 200, "s": "Number of people in the park" }, { "x": "09", "y": 145, "s": "Number of people in the park" }, { "x": "10", "y": 40, "s": "Number of people in the park" }, { "x": "11", "y": 70, "s": "Number of people in the park" }, { "x": "12", "y": 60, "s": "Number of people in the park" }, { "x": "13", "y": 80, "s": "Number of people in the park" }, { "x": "14", "y": 16, "s": "Number of people in the park" }, { "x": "15", "y": 87, "s": "Number of people in the park" }, { "x": "16", "y": 77, "s": "Number of people in the park" }, { "x": "17", "y": 60, "s": "Number of people in the park" }, { "x": "18", "y": 20, "s": "Number of people in the park" }, { "x": "19", "y": 60, "s": "Number of people in the park" }, { "x": "20", "y": 80, "s": "Number of people in the park" }, { "x": "21", "y": 55, "s": "Number of people in the park" }, { "x": "22", "y": 68, "s": "Number of people in the park" }, { "x": "23", "y": 70, "s": "Number of people in the park" }, { "x": "24", "y": 24, "s": "Number of people in the park" } ] - Select the area line chart widget, click above the widget, and set the title to "Statistics on the number of people in the park yesterday Person/Hour".
Figure 19 Setting the title of the area line chart widget
- Select the area line chart widget, click above the widget to show the X-axis gridline and the Y-axis, and hide the Y-axis gridline.
Figure 20 Displaying the X-axis gridline
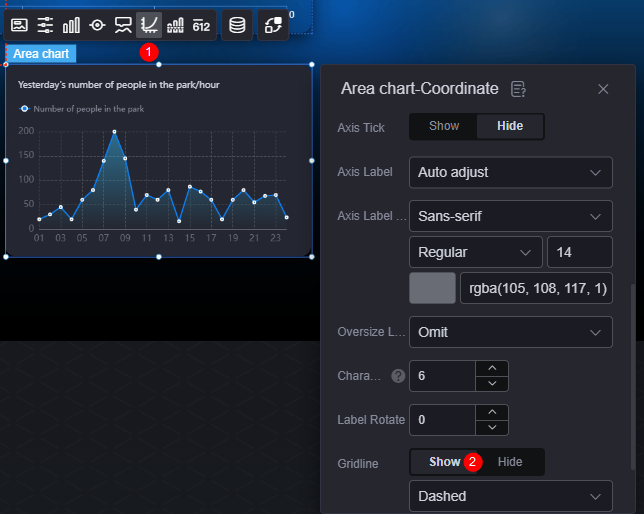 Figure 21 Displaying the Y-axis and hiding the Y-axis gridline
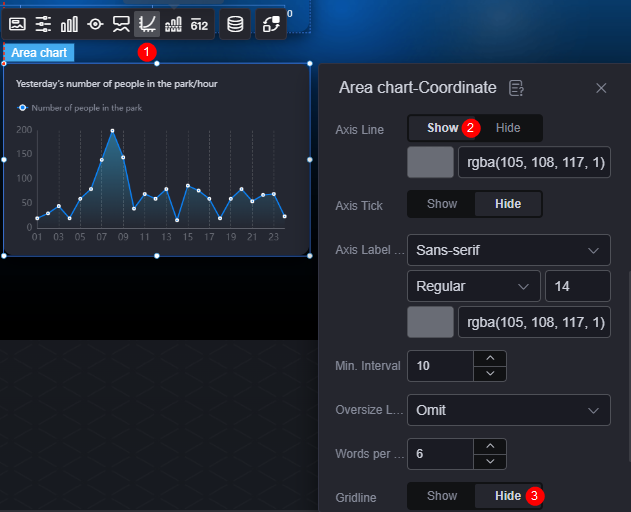
- Select the area chart widget, click
- Click
 in the upper part of the page to save the settings, and click
  to preview the effect.
Figure 22 Previewing the effect
to preview the effect.
Figure 22 Previewing the effect
Feedback
Was this page helpful?
Provide feedbackThank you very much for your feedback. We will continue working to improve the documentation.See the reply and handling status in My Cloud VOC.
For any further questions, feel free to contact us through the chatbot.
Chatbot


