
Developing a Mobile Page for Alarm Handling Statistics
Scenario
This page displays the alarm handling statistics on a mobile device, as shown in Figure 1.
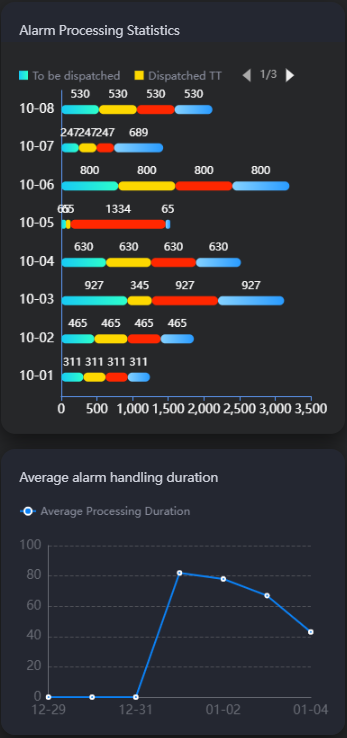
Figure 1 displays the used widgets.
|
Widget |
Description |
|---|---|
|
Horizontal bar chart |
Collects statistics on the alarms by status. The statuses include To-be-assigned, Assigned, Processing, and Closed. |
|
Line chart |
Collects statistics on the average time spent on handling alarms. |
Developing a Mobile Page
- Log in to the Huawei Cloud Astro Canvas console and click Go to Homepage.
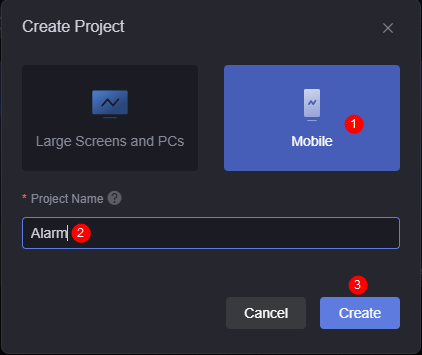
- On the Projects page, click Create Project.
- Select Mobile, enter the project name Alarm, and click Create.
Figure 2 Creating a page for mobile devices
- On the project page, click Create.
- Click New Empty Page, enter the page title "Alarm Handling Statistics", and click Create.
- Configure the horizontal bar chart widget.
- Drag the horizontal bar chart widget to the canvas.
Figure 3 Dragging the horizontal bar chart widget to the canvas

- Select the horizontal bar chart widget, click
 above the widget, configure the data source, and click the save button.
Set the data type to static data and the input data format to JSON, enter the following example data, and click
 to format the data.
[{ "x": "10-01", "y": 311, "s": "To-be-assigned" }, { "x": "10-02", "y": 465, "s": "To-be-assigned" }, { "x": "10-03", "y": 927, "s": "To-be-assigned" }, { "x": "10-04", "y": 630, "s": "To-be-assigned" }, { "x": "10-05", "y": 65, "s": "To-be-assigned" }, { "x": "10-06", "y": 800, "s": "To-be-assigned" }, { "x": "10-07", "y": 247, "s": "To-be-assigned" }, { "x": "10-08", "y": 530, "s": "To-be-assigned" }, { "x": "10-01", "y": 311, "s": "Assigned" }, { "x": "10-02", "y": 465, "s": "Assigned" }, { "x": "10-03", "y": 345, "s": "Assigned" }, { "x": "10-04", "y": 630, "s": "Assigned" }, { "x": "10-05", "y": 65, "s": "Assigned" }, { "x": "10-06", "y": 800, "s": "Assigned" }, { "x": "10-07", "y": 247, "s": "Assigned" }, { "x": "10-08", "y": 530, "s": "Assigned" }, { "x": "10-01", "y": 311, "s": "Processing" }, { "x": "10-02", "y": 465, "s": "Processing" }, { "x": "10-03", "y": 927, "s": "Processing" }, { "x": "10-04", "y": 630, "s": "Processing" }, { "x": "10-05", "y": 1334, "s": "Processing" }, { "x": "10-06", "y": 800, "s": "Processing" }, { "x": "10-07", "y": 247, "s": "Processing" }, { "x": "10-08", "y": 530, "s": "Processing" }, { "x": "10-01", "y": 311, "s": "Closed" }, { "x": "10-02", "y": 465, "s": "Closed" }, { "x": "10-03", "y": 927, "s": "Closed" }, { "x": "10-04", "y": 630, "s": "Closed" }, { "x": "10-05", "y": 65, "s": "Closed" }, { "x": "10-06", "y": 800, "s": "Closed" }, { "x": "10-07", "y": 689, "s": "Closed" }, { "x": "10-08", "y": 530, "s": "Closed" } ] - Select the bar chart widget, click
 above the widget, set the widget title to "Alarm Handling Statistics", and select Blue Gradient Non-sorting for Reference Template.
Figure 4 Selecting Blue Gradient Non-sorting
above the widget, set the widget title to "Alarm Handling Statistics", and select Blue Gradient Non-sorting for Reference Template.
Figure 4 Selecting Blue Gradient Non-sorting Figure 5 Configuring the title
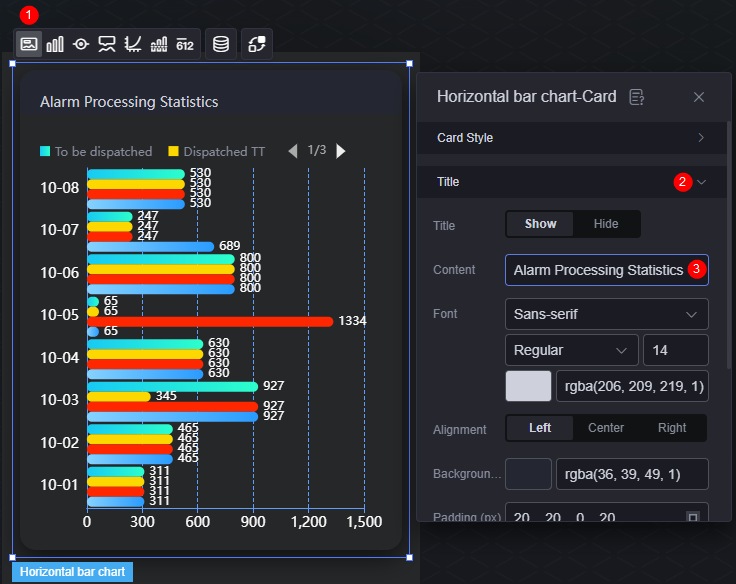
- Select the horizontal bar chart widget, click
 above the widget, enable the horizontal stack effect, and select Show for Data Label of all data series to display the data above the bars.
Figure 6 Enabling the horizontal stack effect
above the widget, enable the horizontal stack effect, and select Show for Data Label of all data series to display the data above the bars.
Figure 6 Enabling the horizontal stack effect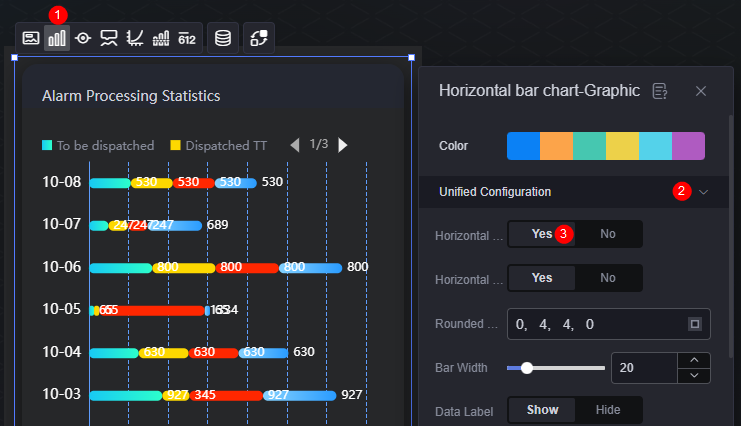 Figure 7 Displaying the data above the bars
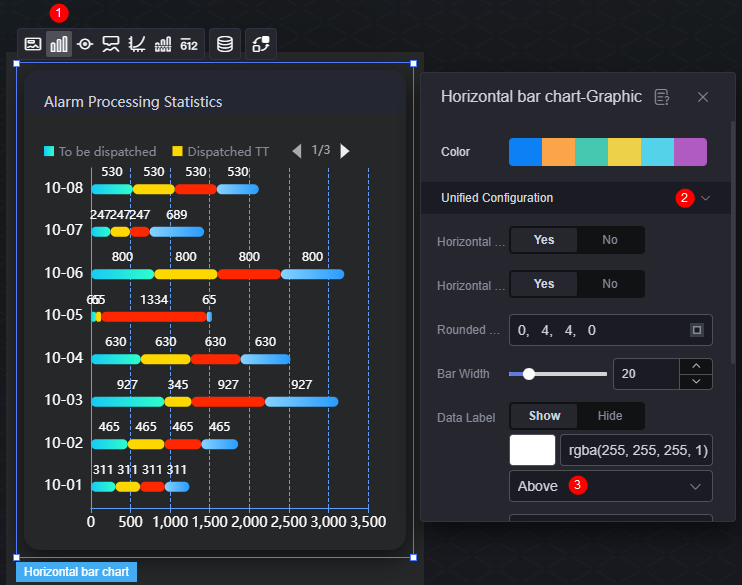
- Select the horizontal bar chart widget and click
 above the widget to hide the Y-axis gridline.
Figure 8 Hiding the gridline
above the widget to hide the Y-axis gridline.
Figure 8 Hiding the gridline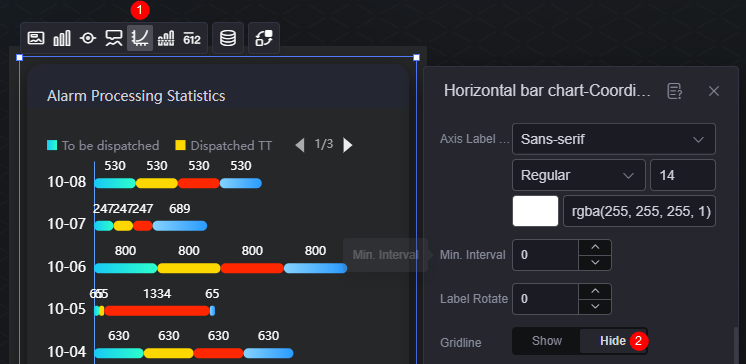
- Drag the horizontal bar chart widget to the canvas.
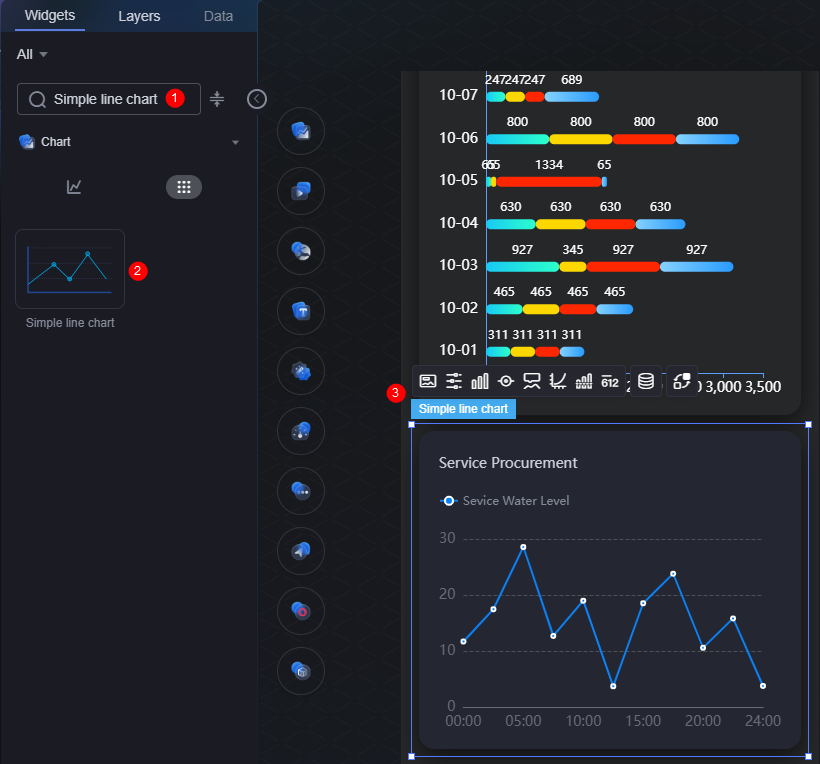
- Configure the line chart widget.
- Drag the line chart widget to the canvas.
Figure 9 Dragging the line chart widget to the canvas
- Select the line chart widget, click above the widget, configure the data source, and click the save button.
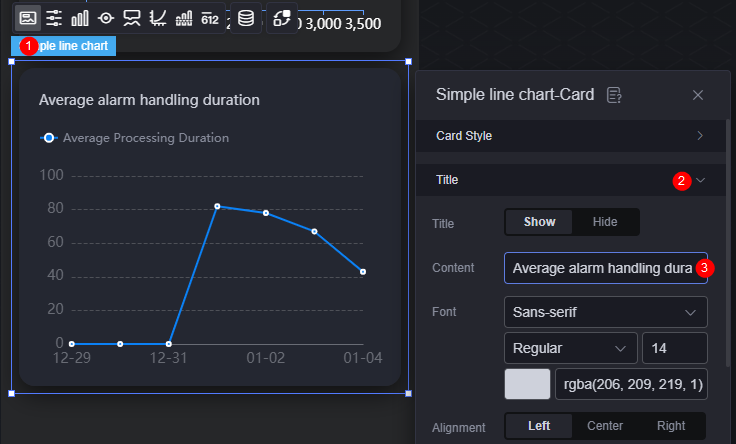
Set the data type to static data and the input data format to JSON, enter the following example data, and click
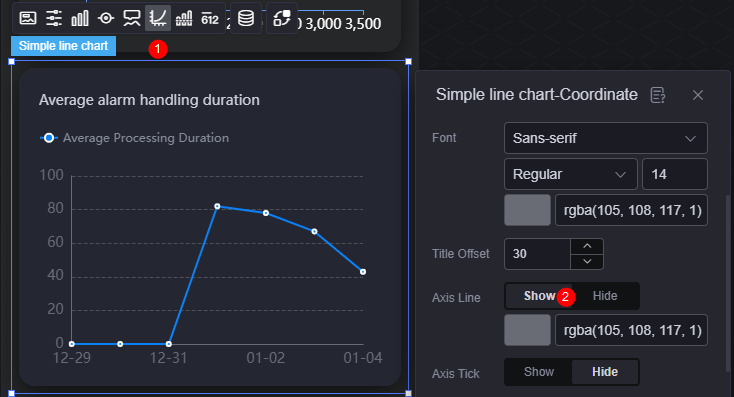
to format the data.[{ "x": "12-29", "y": 0, "s": "Average processing duration" }, { "x": "12-30", "y": 0, "s": "Average processing duration" }, { "x": "12-31", "y": 0, "s": "Average processing duration" }, { "x": "01-01", "y": 82, "s": "Average processing duration" }, { "x": "01-02", "y": 78, "s": "Average processing duration" }, { "x": "01-03", "y": 67, "s": "Average processing duration" }, { "x": "01-04", "y": 43, "s": "Average processing duration" } ] - Select the line chart widget, click above the widget, and set the title to "Average Alarm Handling Duration".
Figure 10 Setting the title of the line chart widget
- Select the line chart widget, click above the widget to display the Y-axis.
Figure 11 Displaying the Y-axis
- Drag the line chart widget to the canvas.
- Click
 in the upper part of the page to save the settings, and click
  to view the page display effect on the different mobile devices.
Figure 12 Previewing the effect
to view the page display effect on the different mobile devices.
Figure 12 Previewing the effect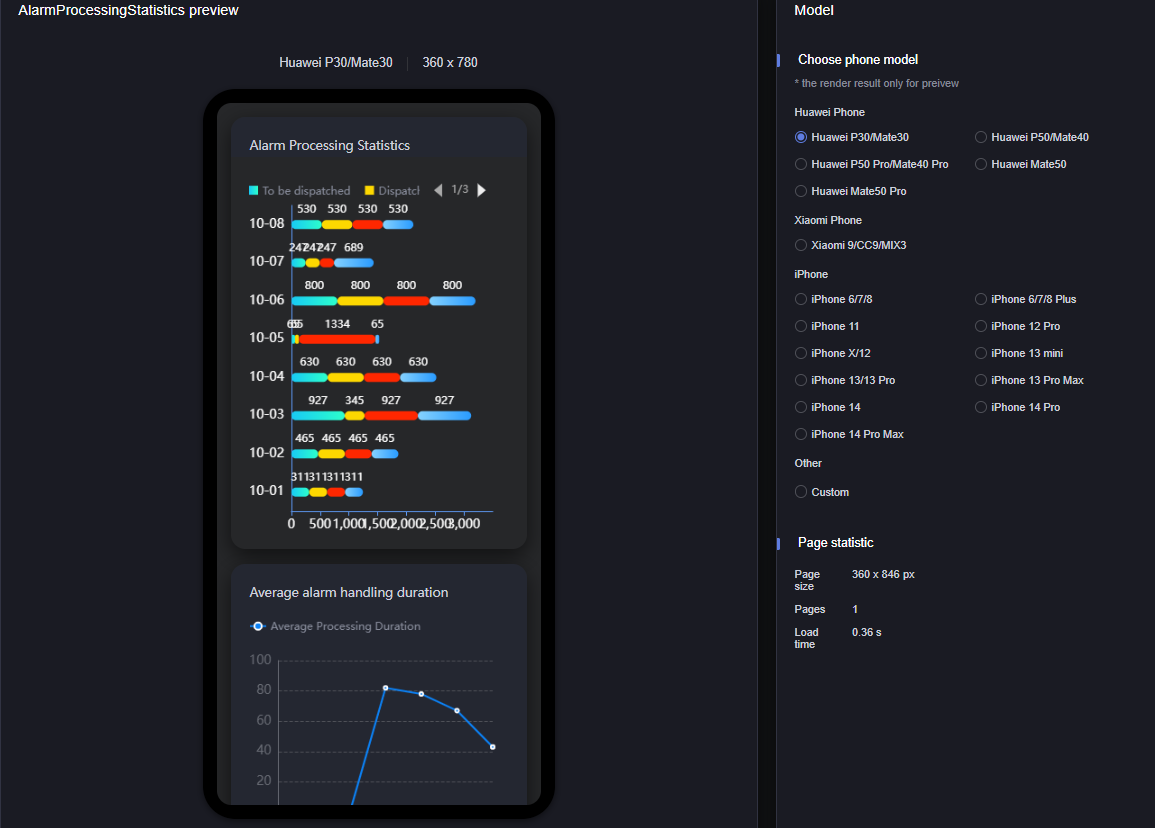
Feedback
Was this page helpful?
Provide feedbackThank you very much for your feedback. We will continue working to improve the documentation.See the reply and handling status in My Cloud VOC.
For any further questions, feel free to contact us through the chatbot.
Chatbot


