Configuring Monitoring by Seconds
Scenarios
TaurusDB supports Monitoring by Seconds. You can set the monitoring interval to 1 second or 5 seconds to view the metric values.
Constraints
This function is unavailable for any DB instances with fewer than eight vCPUs.
Billing
Region | Monitoring Interval | Pay-per-Use (USD/Hour) |
|---|---|---|
CN East-Shanghai1, CN North-Beijing4, CN South-Guangzhou, CN Southwest-Guiyang1, CN North-Ulanqab1, and CN South-Guangzhou-InvitationOnly | 1s | 0.024 |
5s | 0.012 | |
AP-Singapore, AP-Jakarta, CN-Hong Kong, AP-Bangkok, and TR-Istanbul | 1s | 0.032 |
5s | 0.016 | |
LA-Sao Paulo1 | 1s | 0.054 |
5s | 0.027 |
Enabling or Disabling Monitoring by Seconds
- Log in to the TaurusDB console.
- Click
 in the upper left corner and select a region and project.
 - On the Instances page, click the instance name.
- In the navigation pane, choose DBA Assistant > Real-Time Diagnosis.
- Click Performance.
- In the upper part of the page, click Enable Monitoring by Seconds.
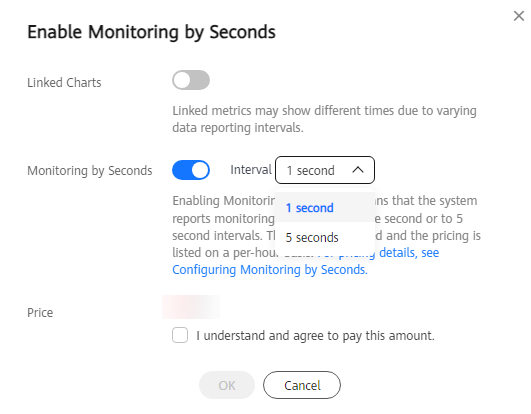
- In the displayed dialog box, click
 next to Monitoring by Seconds, select a collection interval, and click OK.
After you enable this function, monitoring data will be reported and displayed by the second after about five minutes.
Figure 1 Enabling Monitoring by Seconds
- In the navigation pane, click Advanced O&M > Real-Time Monitoring to view metric data.
- View the current data collection period in the upper part of the page.
- Monitoring by Seconds supports the following metrics: CPU usage, memory usage, SELECT statements per second, DELETE statements per second, and INSERT statements per second. You can click View details to view more metrics. For details about the metrics, see TaurusDB Metrics.
- If you need to change the collection period, see Modifying Collection Interval.
- Log in to the TaurusDB console.
- Click
 in the upper left corner and select a region and project.
 - On the Instances page, click the instance name.
- In the navigation pane, choose DBA Assistant > Real-Time Diagnosis.
- Click Performance.
- In the upper part of the page, click Enable Monitoring by Seconds.
- In the displayed dialog box, click
 next to Monitoring by Seconds and click OK.
After you disable this function, monitoring data will be reported and displayed by the minute after about five minutes.
Modifying Collection Interval
- Log in to the TaurusDB console.
- Click
 in the upper left corner and select a region and project.
 - On the Instances page, click the instance name.
- In the navigation pane, choose DBA Assistant > Real-Time Diagnosis.
- Click Performance.
- In the upper part of the page, click Enable Monitoring by Seconds.
- Select the monitoring interval and click OK.Monitoring data will be reported based on the new collection interval about 5 minutes later.Figure 2 Modifying the collection interval

Feedback
Was this page helpful?
Provide feedbackThank you very much for your feedback. We will continue working to improve the documentation.See the reply and handling status in My Cloud VOC.
For any further questions, feel free to contact us through the chatbot.
Chatbot


