
هذه الصفحة غير متوفرة حاليًا بلغتك المحلية. نحن نعمل جاهدين على إضافة المزيد من اللغات. شاكرين تفهمك ودعمك المستمر لنا.
- Service Overview
- User Guide
- Best Practices
- FAQs
- General Reference
Show all
Copied.
MTD Overview
This section describes how to view the MTD service overview, process flow, and alarms on the Detection Result page.
Prerequisites
You have purchased the MTD service in the current region.
Procedure
- Log in to the management console.
- Click
 in the upper left corner of the management console and select a region or project.
 - Click
 in the navigation pane on the left and choose Security & Compliance > Managed Threat Detection.
Figure 1 Home page of MTD
in the navigation pane on the left and choose Security & Compliance > Managed Threat Detection.
Figure 1 Home page of MTD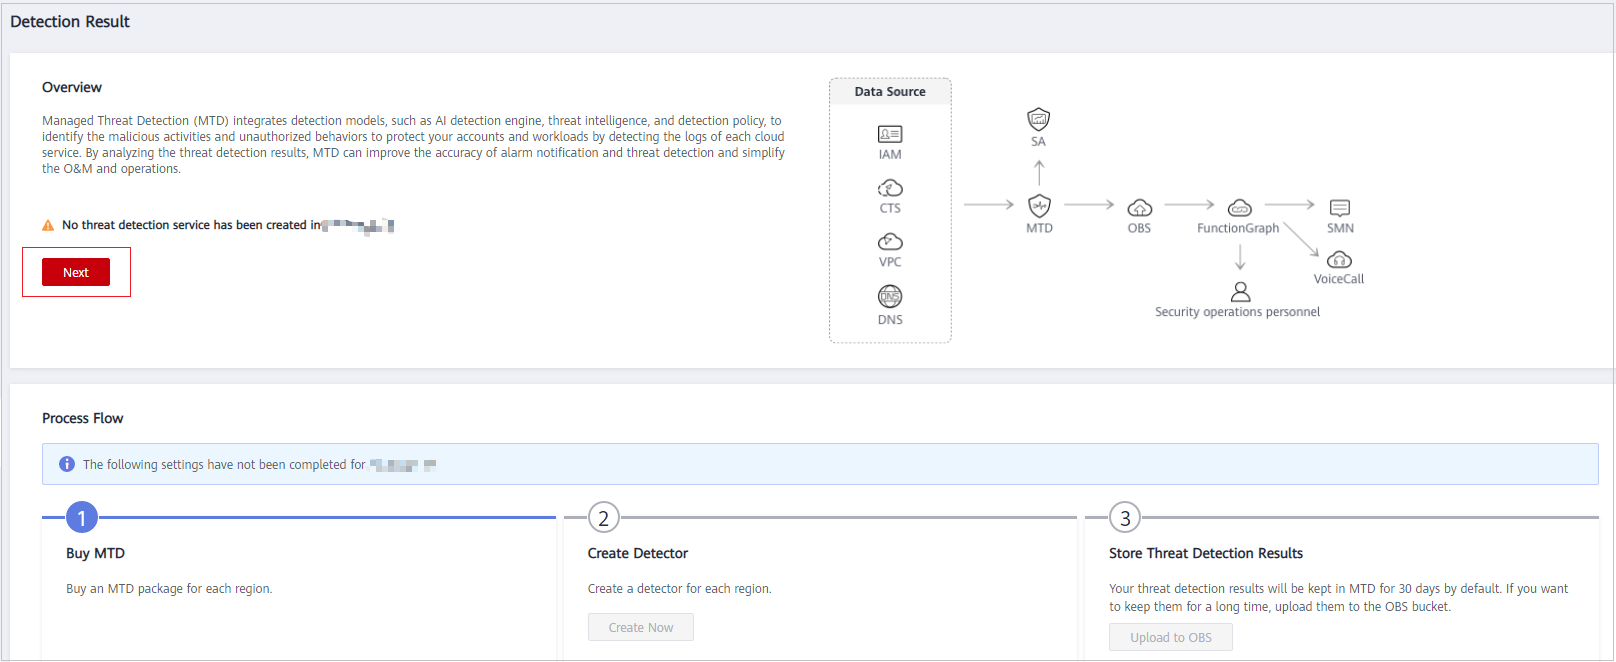
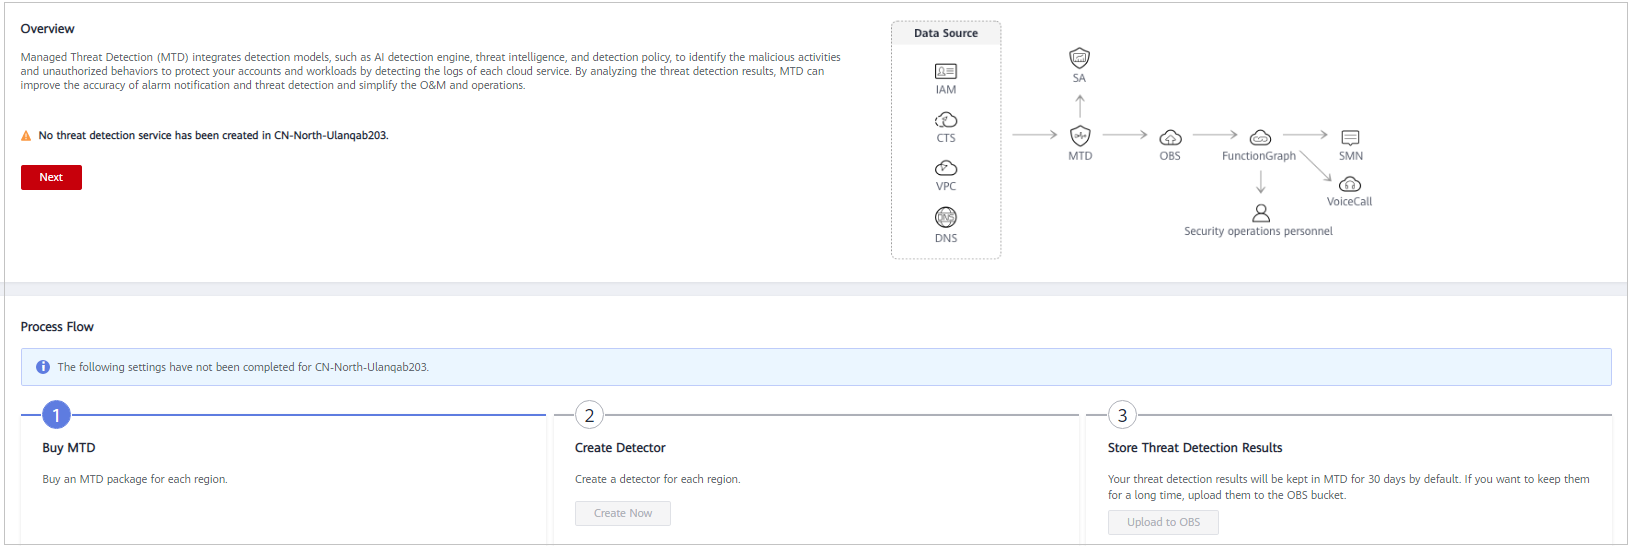
- Check the service overview. It introduces main functions of MTD and the service architecture.
- No threat detection service has been created is displayed, if you did not create the detection service in your region. You can click Buy MTD in the upper right corner to go to the service purchase page.
Figure 2 Detection service not purchased
- If you have purchased MTD package in your region, the service overview is automatically hidden. To show it, click
 .
Figure 3 Service overview
.
Figure 3 Service overview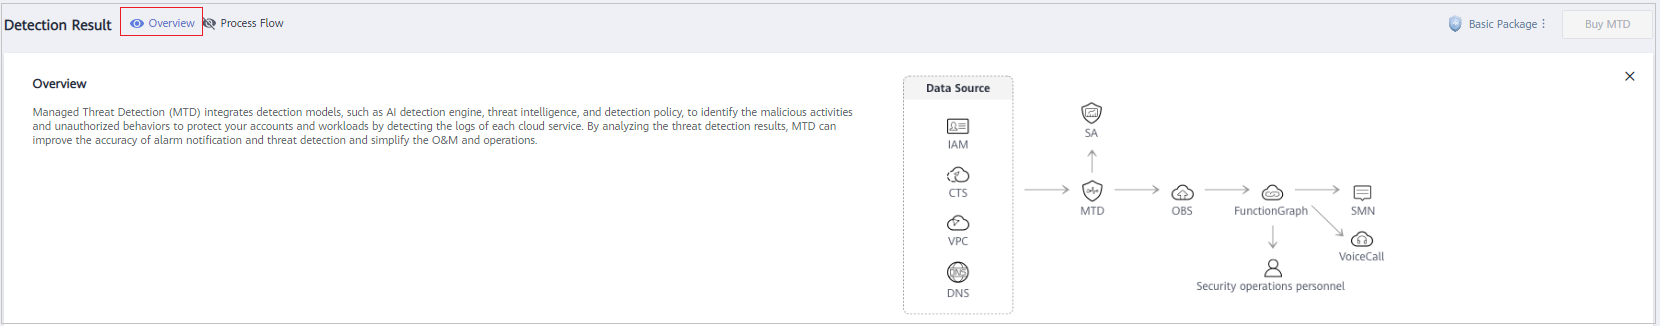
If you click the close button in the upper right corner, the overview pane will not be displayed next time.
 NOTE:
NOTE:
If you did not purchase the MTD package in the current region, the service overview module is displayed by default and cannot be closed.
- No threat detection service has been created is displayed, if you did not create the detection service in your region. You can click Buy MTD in the upper right corner to go to the service purchase page.
- View the process flow.
To use MTD, you need to buy MTD, create a detector, and store threat detection results.
- Buy MTD.
You need to purchase a package for each region. If you have purchased one in the current region,
 in the process flow changes to
  .
. - Create a detector.
Create a detector for each region. If a detector has been created for the current region,
 changes to
  .
. - Configure data storage.
By default, MTD stores the detection results of the last 30 days. To store the data of a longer period (180 days to meet compliance requirements), click Upload to OBS to go to the Data Synchronization page and enable the function. For details, see Synchronizing Detection Results.
- Click the close button in the upper right corner of the pane. The overview pane will not be displayed next time.
NOTE:
- If you have not created a detector or enabled the all log detection items for your services in the current region, the Process Flow pane is displayed by default and cannot be closed.
- After Process Flow is closed, you can click Process Flow in the upper part of the page to show the Process Flow.
- Buy MTD.
- View package details. The name of the purchased package is displayed in the upper right corner of the page. Move the cursor to the package. The package details are displayed, as shown in Figure 4.
- View alarm types and alarm details. For details, see Viewing Detection Results.

Feedback
Was this page helpful?
Provide feedbackThank you very much for your feedback. We will continue working to improve the documentation.See the reply and handling status in My Cloud VOC.
For any further questions, feel free to contact us through the chatbot.
Chatbot


