ALM-38002 Kafka Heap Memory Usage Exceeds the Threshold
Description
The system checks the Kafka service status every 60 seconds. The alarm is generated when the heap memory usage of a Kafka instance exceeds the threshold (95% of the maximum memory) for 10 consecutive times.
When the Trigger Count is 1, this alarm is cleared when the heap memory usage is less than or equal to the threshold. When the Trigger Count is greater than 1, this alarm is cleared when the heap memory usage is less than or equal to 90% of the threshold.
Attribute
|
Alarm ID |
Alarm Severity |
Automatically Cleared |
|---|---|---|
|
38002 |
Major |
Yes |
Parameters
|
Name |
Meaning |
|---|---|
|
Source |
Specifies the cluster for which the alarm is generated. |
|
ServiceName |
Specifies the service name for which the alarm is generated. |
|
RoleName |
Specifies the role name for which the alarm is generated. |
|
HostName |
Specifies the object (host ID) for which the alarm is generated. |
|
Trigger Condition |
Specifies the threshold triggering the alarm. If the current indicator value exceeds this threshold, the alarm is generated. |
Impact on the System
If the available direct memory of the Kafka service is insufficient, a memory overflow occurs and the broker instance breaks down. As a result, the broker cannot provide read and write services properly.
Possible Causes
The heap memory of the Kafka instance is overused or the heap memory is inappropriately allocated.
Procedure
Check heap memory usage.
- On the FusionInsight Manager portal, choose O&M > Alarm > Alarms > Kafka Heap Memory Usage Exceeds the Threshold > Location. Check the host name of the instance involved in this alarm.
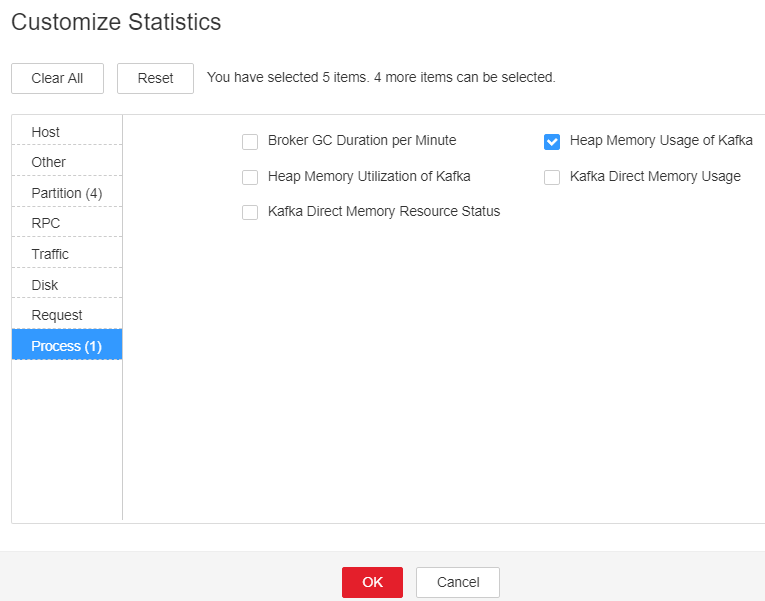
- On the FusionInsight Manager portal, choose Cluster > Name of the desired cluster > Services > Kafka > Instance. Click the instance for which the alarm is generated to go to the page for the instance. Click the drop-down list in the upper right corner of the chart area, choose Customize > Process > Heap Memory Usage of Kafka, and click OK.
Figure 1 Heap Memory Usage of Kafka

- Check whether the used heap memory of Kafka reaches 95% of the maximum heap memory specified for Kafka.
Check the heap memory size configured for Kafka.
- On the FusionInsight Manager portal, choose Cluster > Name of the desired cluster > Services > Kafka > Configurations > All Configurations> Broker(Role) > Environment. Increase the value of KAFKA_HEAP_OPTS by referring to the Note.
Figure 2 KAFKA_HEAP_OPTS


- It is recommended that -Xmx and -Xms be set to the same value.
- You are advised to view Heap Memory Usage of Kafka by referring to Step 2, and set the value of KAFKA_HEAP_OPTS to twice the value of Heap Memory Used by Kafka.
- Check whether the alarm is cleared.
- If yes, no further action is required.
- If no, go to Step 6.
Collect fault information.
- On the FusionInsight Manager portal, choose O&M > Log > Download.
- Select Kafka in the required cluster from the Service drop-down list.
- Click
 in the upper right corner, and set Start Date and End Date for log collection to 10 minutes ahead of and after the alarm generation time, respectively. Then, click Download.
 - Send the collected fault logs to O&M personnel for help.
Alarm Clearing
After the fault is rectified, the system automatically clears this alarm.
Related Information
None
Feedback
Was this page helpful?
Provide feedbackThank you very much for your feedback. We will continue working to improve the documentation.See the reply and handling status in My Cloud VOC.
For any further questions, feel free to contact us through the chatbot.
Chatbot


