Variable Assignment
Use this diagram element by referring to the JSON Data Invoking diagram element. This diagram element is used to obtain call-associated data and assign values.
Diagram Element

Parameter Description
- Node Name: name of a node.
- Description: details of a node.
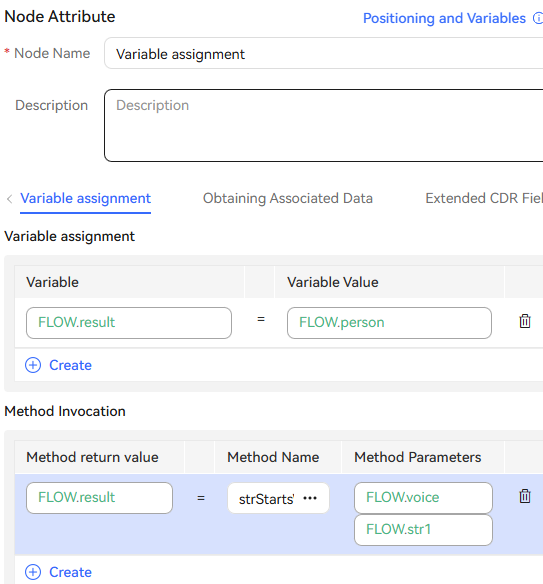
- Variable assignment: variable name and variable value. The output parameter returned by the interface is valid only on the current node. If you want to use the value in subsequent flow nodes, define a variable here and assign the value of the output parameter to the variable.

In a security subflow scenario:
- When the variable value is IVRREQUEST.input, the variable name must be a variable that is saved after being encrypted.
- If the variable value contains a variable that is saved after being encrypted and the variable name is not a variable that is saved after being encrypted, the system displays a message indicating that the expression contains an encrypted variable and data security should be concerned. However, the customer storage flow is not affected.
- Method Invocation: Built-in functions described in Built-in Functions can be used if data processing, such as truncation, length obtaining, conversion, and check, is required by businesses.

In a security subflow scenario:
- If the method parameter contains a variable that is saved after being encrypted and the return value is not a variable that is saved after being encrypted, the system displays a message indicating that the expression contains an encrypted variable and data security should be concerned. However, the customer storage flow is not affected.
Condition Branch Description
|
Condition Branch |
Description |
Usage |
|---|---|---|
|
SYSERROR_INNER |
ODFS internal error |
Triggered when an unknown error occurs in the ODFS. If no satisfaction option is selected, the flow goes to the exception handling flow. |
Using the Diagram Element
(1) When the call-associated data is in JSON format, this diagram element can be used to obtain the parameters of a specified node and assign values to the parameters.
(2) Built-in functions described in Built-in Functions can be used if data processing, such as truncation, length obtaining, conversion, and check, is required by businesses.
Click the diagram element or drag it to the canvas, and set parameters based on the parameter description.
Typical Application Scenario
A customer makes a call to the AICC, and the call is routed to a skill queue. When all agents in the skill queue are busy, if Queuing Method is set to IVR and an intelligent IVR flow is selected for the skill queue, the intelligent IVR flow can use this diagram element to obtain the current queuing status of the customer and play the waiting tone to the customer. Therefore, the customer can determine whether to continue waiting based on the queuing status.
Scenario 1: Assigning Values to Variables
During data value assignment, in addition to string and integer data, expression calculation is also supported. Integer data supports the following arithmetic operations: +, -, *, and % (). Data supports FLOW, GLOBAL, and SYS. Example: (FLOW.xxx+FLOW.yyy)*GLOBAL.zzz. Note that when a slash (/) is used for division, the calculation result needs to be received using data of the string type. Integers do not support decimals. String data supports comparison, case conversion, character string concatenation, substring calculation, and length calculation. Example: FLOW.aaa=="Huawei" FLOW.bb.to FLOW.a.toUpperCase() FLOW.A.toLowerCase() FLOW.hua+FLOW.wei FLOW.len.substring(0,3)FLOW.zzzz.length()

Scenario 2: Obtaining Call-associated Data
- Orchestrate a flow.
Example 1: Assume that the call-associated data is {"data":{"test": "Call-associated data test"}}.
Use the Variable assignment diagram element to assign the value of the test field in the call-associated data to the flow variable FLOW.str1. In this example, the value of FLOW.str1 is Call-associated data test.
Example 2: If the call-associated data of an outbound call task is {"iSales":{"name":"Tom"}}, the content Tom can be obtained by setting iSales.name.
The following figure shows the screenshot based on example 1.
Figure 1 Obtaining call-associated data
- Configure an intelligent robot and set Dialog Type to IVR flow.
- Configure a common IVR, add the Transfer diagram element, select Transfer to Intelligent IVR, and configure call-associated data.
- Add the Variable assignment diagram element to the intelligent IVR flow, and configure a variable on the Obtaining Associated Data tab page to receive call-associated data from the common IVR.
- Choose and add a called route. Set the IVR to the added intelligent IVR.
- Log in to the OpenEye using a softphone number to simulate a customer, and dial the access code added on the Called Party page. Check whether the call-associated data obtained in the intelligent IVR flow is correct.
Scenario 3: Extended CDR Fields
You can set 10 service information fields (extfield1 to extfield10) to collect customer information and customer operations to be saved in the IVR flow. These fields can be used only when the system parameter IVRCDRCTRLPARAMS is enabled. Do not assign values to encrypted variables. The values of encrypted variables are processed as ****** for storage.

Feedback
Was this page helpful?
Provide feedbackThank you very much for your feedback. We will continue working to improve the documentation.See the reply and handling status in My Cloud VOC.
For any further questions, feel free to contact us through the chatbot.
Chatbot


