Component OOM of the Cloud Native Cluster Monitoring Add-on
The Cloud Native Cluster Monitoring add-on in a cluster may have OOM errors when the cluster is running. This section describes how to handle OOM errors.
If the components of this add-on have OOM errors, refer to:
- prometheus-lightweight OOM
- prometheus-server OOM
- thanos-query and thanos-sidecar OOM
- kube-state-metrics OOM
Preparations
Ensure that the memory of the node where workloads are deployed is sufficient to prevent OOM caused by insufficient node memory.
prometheus-lightweight OOM

prometheus-lightweight exists only when the local storage is disabled.
prometheus-lightweight is a lightweight collection component. Generally, there is no OOM error. If there is an OOM error, the remote storage (AOM or third-party storage) may be abnormal. You are advised to view the logs and dashboard of prometheus-lightweight.
- Go to the StatefulSets tab (Workloads > StatefulSets), select the monitoring namespace, locate prometheus-lightweight, and click View Log in the Operation column to locate the fault.

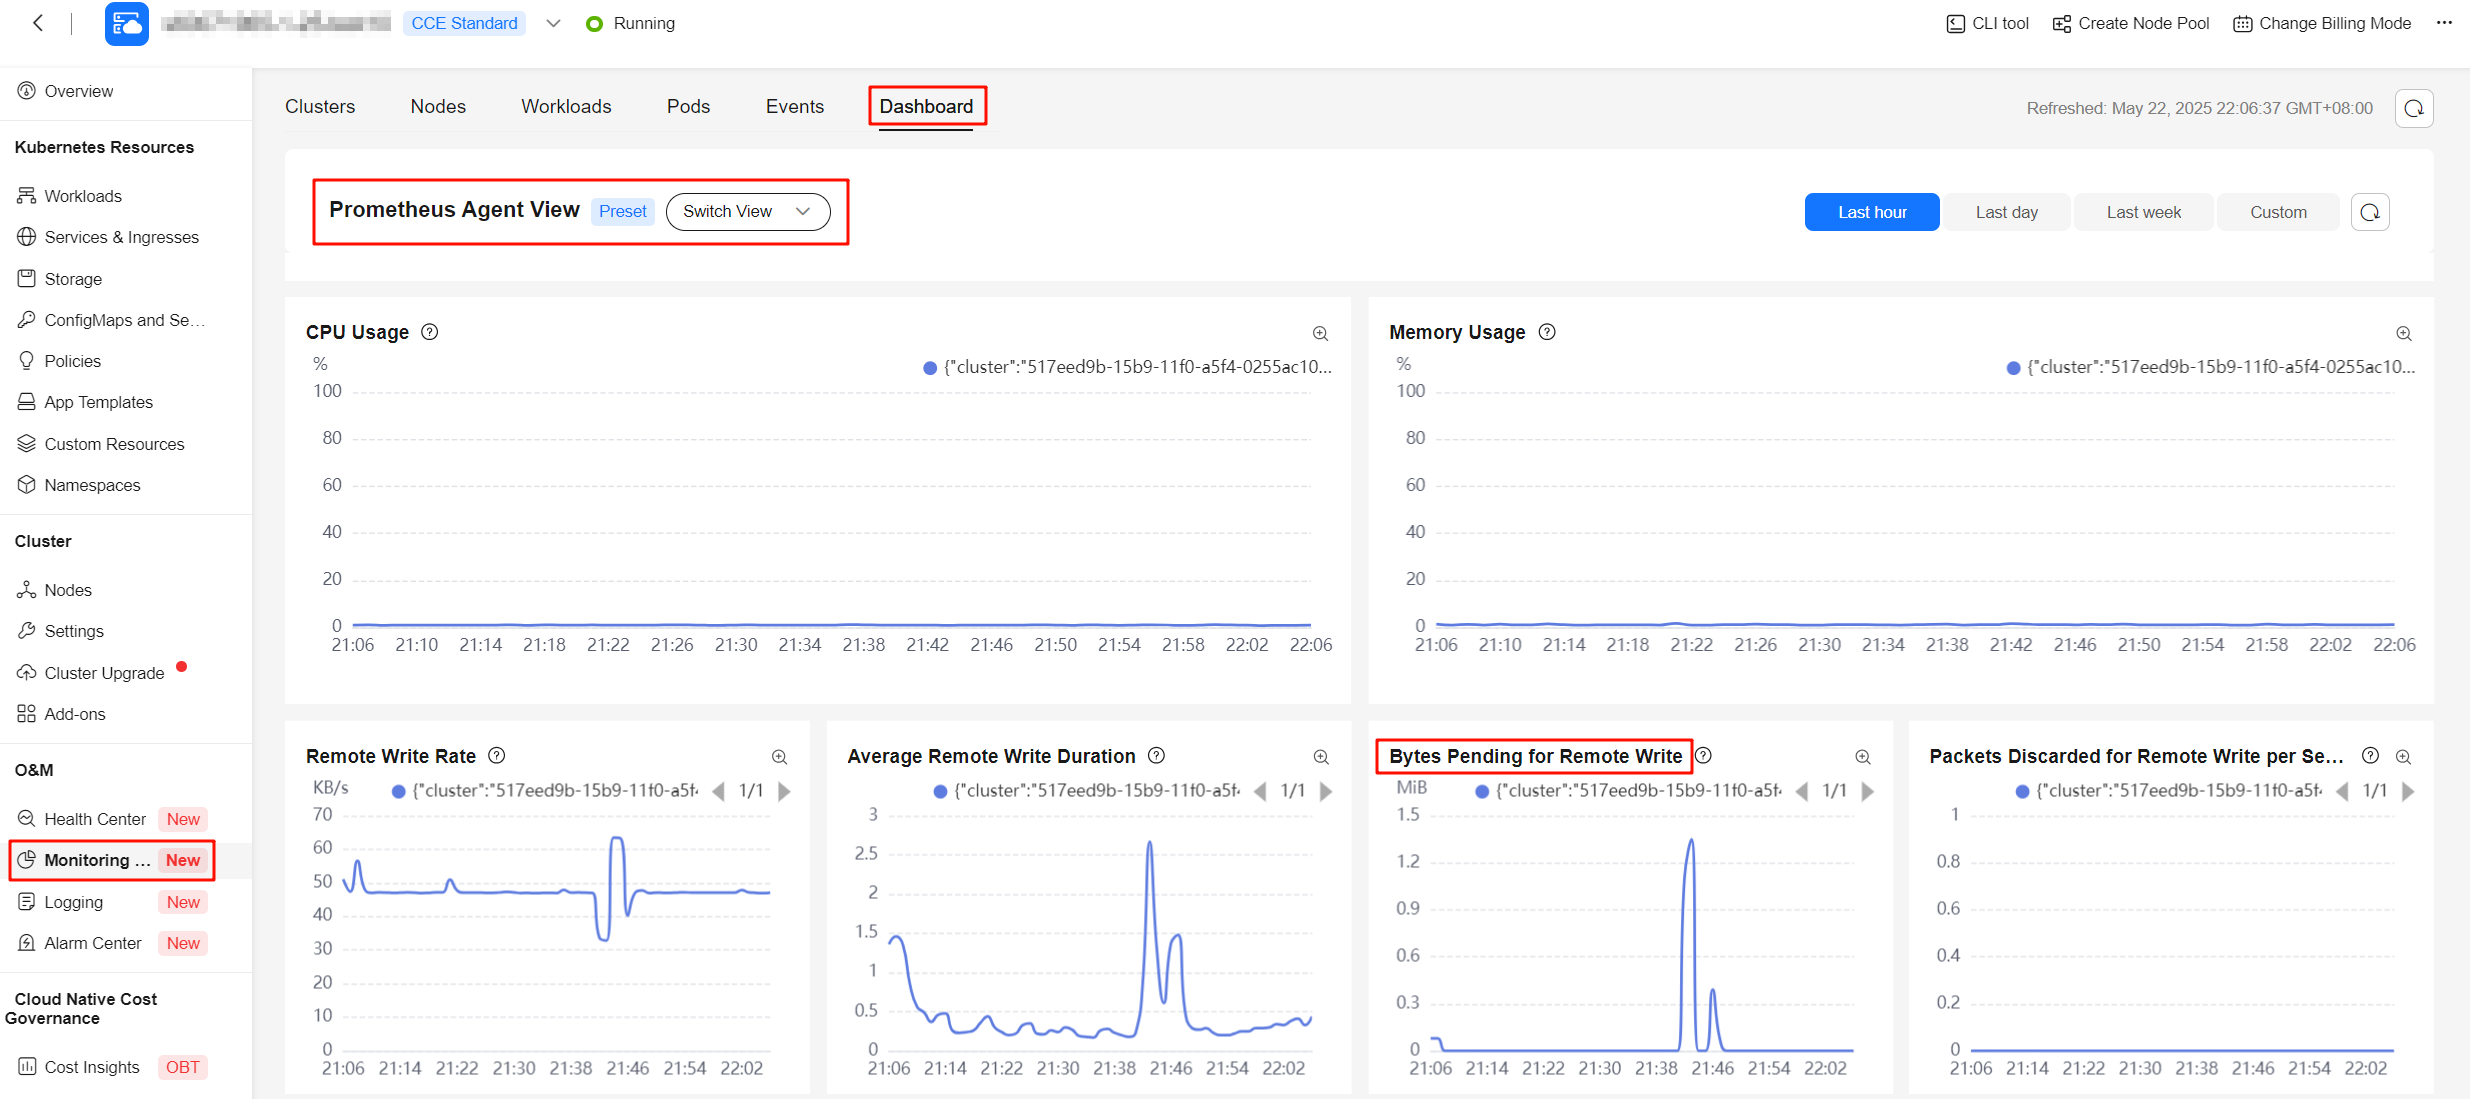
- Go to the Dashboard tab (Monitoring Center > Dashboard), select Prometheus-Agent View, and check Bytes Pending for Remote Write. The value of this metric must be less than 100 MiB for a long time.

prometheus-server OOM

prometheus-server exists only when the local storage is enabled.
prometheus-server stores metrics of the last two hours in the memory for quick query. As the number of metrics increases, the memory usage increases accordingly.
If prometheus-server has an OOM error, it may persist. This is because the full metrics of the last two hours need to be loaded from a write-ahead log (WAL) to the memory each time prometheus-server starts. This process usually consumes more memory than that when prometheus-server runs normally.
On the add-ons page, you can increase the memory limit of prometheus-server by 50% to 100% and then observe prometheus-server. (The prometheus-server startup may take 5 to 30 minutes, depending on the total number of metrics and disk performance.)
thanos-query and thanos-sidecar OOM

thanos-query and thanos-sidecar exist only when the local storage and high availability are enabled. thanos-query deduplicates data from high-availability pairs.
If a large number of long-term queries are executed or there are a large number of concurrent queries, thanos-query and thanos-sidecar may have OOM errors.
On the add-ons page, you can increase the CPU and memory limits for thanos-query and thanos-sidecar by 100%.
kube-state-metrics OOM
kube-state-metrics exposes metrics about Kubernetes cluster objects. The metric scale correlates with the cluster scale.
You are advised to adjust the shards and resources of kube-state-metrics. For details, see Configuring the Cloud Native Cluster Monitoring Add-on in a Large-Scale Cluster.
Feedback
Was this page helpful?
Provide feedbackThank you very much for your feedback. We will continue working to improve the documentation.


