- What's New
- Function Overview
- Service Overview (2.0)
- Getting Started (2.0)
-
User Guide (2.0)
- Introduction
- Access Center
- Dashboard
- Alarm Management
- Metric Browsing
- Log Analysis
-
Prometheus Monitoring
- Prometheus Monitoring
- Creating Prometheus Instances
- Managing Prometheus Instances
- Configuring a Recording Rule
- Metric Management
- Dashboard Monitoring
-
Access Guide
- Connecting Node Exporter
-
Exporter Access in the VM Scenario
- Access Overview
- MySQL Component Access
- Redis Component Access
- Kafka Component Access
- Nginx Component Access
- MongoDB Component Access
- Consul Component Access
- HAProxy Component Access
- PostgreSQL Component Access
- Elasticsearch Component Access
- RabbitMQ Component Access
- Access of Other Components
- Custom Plug-in Access
- Other Operations
- Obtaining the Service Address of a Prometheus Instance
- Viewing Prometheus Instance Data Through Grafana
- Reading Prometheus Instance Data Through Remote Read
- Reporting Self-Built Prometheus Instance Data to AOM
- Resource Usage Statistics
- Business Monitoring (Beta)
- Infrastructure Monitoring
- Settings
- Remarks
- Permissions Management
- Auditing
- Subscribing to AOM 2.0
- Upgrading to AOM 2.0
- Best Practices (2.0)
-
FAQs (2.0)
- Overview
- Dashboard
- Alarm Management
- Log Analysis
- Prometheus Monitoring
- Infrastructure Monitoring
-
Collection Management
- Are ICAgent and UniAgent the Same?
- What Can I Do If an ICAgent Is Offline?
- Why Is an Installed ICAgent Displayed as "Abnormal" on the Agent Management Page?
- Why Can't I View the ICAgent Status After It Is Installed?
- Why Can't AOM Monitor CPU and Memory Usage After ICAgent Is Installed?
- How Do I Obtain an AK/SK?
- FAQs About ICAgent Installation
- How Do I Enable the Nginx stub_status Module?
- Other FAQs
-
API Reference
- Before You Start
- API Overview
- Calling APIs
-
APIs
-
Alarm
- Querying the Event Alarm Rule List
- Adding an Event Alarm Rule
- Modifying an Event Alarm Rule
- Deleting an Event Alarm Rule
- Obtaining the Alarm Sending Result
- Deleting a Silence Rule
- Adding a Silence Rule
- Modifying a Silence Rule
- Obtaining the Silence Rule List
- Querying an Alarm Action Rule Based on Rule Name
- Adding an Alarm Action Rule
- Deleting an Alarm Action Rule
- Modifying an Alarm Action Rule
- Querying the Alarm Action Rule List
- Querying Metric or Event Alarm Rules
- Adding or Modifying Metric or Event Alarm Rules
- Deleting Metric or Event Alarm Rules
- Querying Events and Alarms
- Counting Events and Alarms
- Reporting Events and Alarms
-
Monitoring
- Querying Time Series Objects
- Querying Time Series Data
- Querying Metrics
- Querying Monitoring Data
- Adding Monitoring Data
- Adding or Modifying One or More Service Discovery Rules
- Deleting a Service Discovery Rule
- Querying Existing Service Discovery Rules
- Adding a Threshold Rule
- Querying the Threshold Rule List
- Modifying a Threshold Rule
- Deleting a Threshold Rule
- Querying a Threshold Rule
- Deleting Threshold Rules in Batches
-
Prometheus Monitoring
- Querying Expression Calculation Results in a Specified Period Using the GET Method
- (Recommended) Querying Expression Calculation Results in a Specified Period Using the POST Method
- Querying the Expression Calculation Result at a Specified Time Point Using the GET Method
- (Recommended) Querying Expression Calculation Results at a Specified Time Point Using the POST Method
- Querying Tag Values
- Obtaining the Tag Name List Using the GET Method
- (Recommended) Obtaining the Tag Name List Using the POST Method
- Querying Metadata
- Log
- Prometheus Instance
- Configuration Management
-
Alarm
- Historical APIs
- Examples
- Permissions Policies and Supported Actions
- Appendix
- SDK Reference
-
Service Overview (1.0)
- What Is AOM?
- Product Architecture
- Functions
- Application Scenarios
- Edition Differences
-
Metric Overview
- Introduction
- Network Metrics and Dimensions
- Disk Metrics and Dimensions
- Disk Partition Metrics
- File System Metrics and Dimensions
- Host Metrics and Dimensions
- Cluster Metrics and Dimensions
- Container Metrics and Dimensions
- VM Metrics and Dimensions
- Instance Metrics and Dimensions
- Service Metrics and Dimensions
- Restrictions
- Privacy and Sensitive Information Protection Statement
- Relationships Between AOM and Other Services
- Basic Concepts
- Permissions
- Billing
- Getting Started (1.0)
-
User Guide (1.0)
- Overview
- Subscribing to AOM
- Permissions Management
- Connecting Resources to AOM
- Monitoring Overview
- Alarm Management
- Resource Monitoring
- Log Management
- Configuration Management
- Auditing
- Upgrading to AOM 2.0
- Best Practices (1.0)
-
FAQs (1.0)
- User FAQs
-
Consultation FAQs
- What Are the Usage Restrictions of AOM?
- What Are the Differences Between AOM and APM?
- How Do I Distinguish Alarms from Events?
- What Is the Relationship Between the Time Range and Statistical Cycle?
- Does AOM Display Logs in Real Time?
- How Can I Do If I Cannot Receive Any Email Notification After Configuring a Threshold Rule?
- Why Are Connection Channels Required?
-
Usage FAQs
- What Can I Do If I Do Not Have the Permission to Access SMN?
- What Can I Do If Resources Are Not Running Properly?
- How Do I Set the Full-Screen Online Duration?
- What Can I Do If the Log Usage Reaches 90% or Is Full?
- How Do I Obtain an AK/SK?
- How Can I Check Whether a Service Is Available?
- Why Is the Status of an Alarm Rule Displayed as "Insufficient"?
- Why the Status of a Workload that Runs Normally Is Displayed as "Abnormal" on the AOM Page?
- How Do I Create the apm_admin_trust Agency?
- What Is the Billing Policy of Logs?
- Why Can't I See Any Logs on the Console?
- What Can I Do If an ICAgent Is Offline?
- Why Can't the Host Be Monitored After ICAgent Is Installed?
- Why Is "no crontab for root" Displayed During ICAgent Installation?
- Why Can't I Select an OBS Bucket When Configuring Log Dumping on AOM?
- Why Can't Grafana Display Content?
Configuring a Recording Rule
Recording rules can be used for secondary development of metric data. Some queries may require a large amount of computing on the query end, resulting in high pressure on this end. By setting recording rules, you can move the computing process to the write end, reducing resource usage on the query end. Especially in large-scale clusters and complex service scenarios, recording rules can reduce PromQL complexity, thereby improving the query performance and preventing slow user configuration and queries.
Prerequisite
Both your service and CCE cluster have been connected to a Prometheus instance for CCE. For details, see Prometheus Instance for CCE.
Configuring a Recording Rule
- Log in to the AOM 2.0 console.
- In the navigation pane on the left, choose Prometheus Monitoring > Instances.
- In the instance list, click a Prometheus instance for CCE.
- In the navigation pane on the left, choose Settings. In the Recording Rules area, click Edit RecordingRule.yaml.
- In the dialog box that is displayed, delete the default content and enter a custom recording rule.
NOTE:
Only one RecordingRule.yaml file needs to be configured for a cluster. Each rule group name must be unique.
Figure 1 Configuring a recording rule
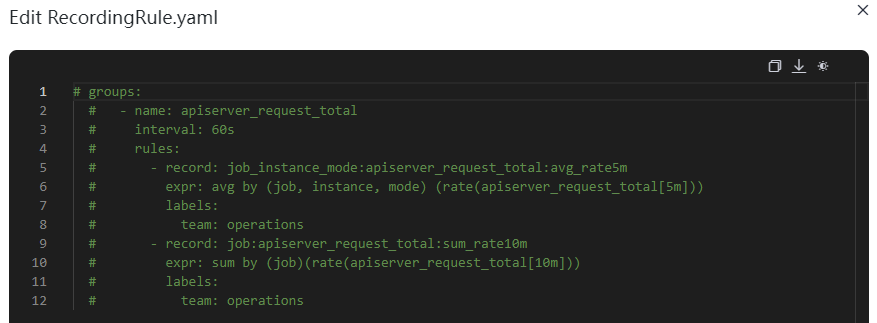
Table 1 Recording rule parameters Parameter
Description
groups
Rule group. You can set multiple rule groups in one RecordingRule.yaml file.
name
Rule group name. Each rule group name must be unique.
interval
(Optional) Execution interval of a rule group. The default value is 60s.
rules
Rule. A rule group can contain multiple rules.
record
Name of a rule. The name must comply with Prometheus metric name specifications.
expr
Calculation expression. It is used to calculate metric values. It must comply with PromQL requirements.
labels
(Optional) Label of a metric.
Example of a recording rule:
groups: - name: apiserver_request_total interval: 60s rules: - record: apiserver_request_rate expr: avg by (job, instance, mode) (rate(apiserver_request_total[5m])) labels: team: operations - record: job:apiserver_request_total:sum_rate10m expr: sum by (job)(rate(apiserver_request_total[10m])) labels: team: operations
- Click OK.
Viewing Recording Rule Metrics
After a recording rule is configured, you can view its metrics on the Metric Browsing page of AOM or using Grafana.
Method 1: Viewing Metrics on the Metric Browsing Page of AOM
- On the Metric Browsing page, select a Prometheus instance for which a recording rule has been configured from the drop-down list.
- Click All metrics and enter the name of a recording rule metric in the search box to view its details.
Method 2: Viewing Metrics Using Grafana
For details, see Viewing Prometheus Instance Data Through Grafana.
Feedback
Was this page helpful?
Provide feedbackThank you very much for your feedback. We will continue working to improve the documentation.