
Configuring Metric Collection Rules for CCE Clusters
By adding ServiceMonitor or PodMonitor, you can configure metric collection rules to monitor the applications deployed in CCE clusters.
Prerequisite
Both your service and CCE cluster have been connected to a Prometheus instance for CCE. For details, see Using Prometheus Monitoring to Monitor CCE Cluster Metrics.
Constraints
Only when kube-prometheus-stack installed on the Add-ons page of CCE or the Integration Center page of the Prometheus instance for CCE on AOM is 3.9.0 or later and is still running, can you enable or disable collection rules.
To view the kube-prometheus-stack status, log in to the CCE console and access the cluster page, choose Add-ons in the navigation pane, and locate that add-on on the right.
Adding ServiceMonitor
- Log in to the AOM 2.0 console.
- In the navigation pane on the left, choose Prometheus Monitoring > Instances.
- In the instance list, click a Prometheus instance for CCE.
- In the navigation pane on the left, choose Metric Management. On the Settings tab page, click ServiceMonitor.
- Click Add ServiceMonitor. In the displayed dialog box, set related parameters and click OK. Figure 1 Adding ServiceMonitor
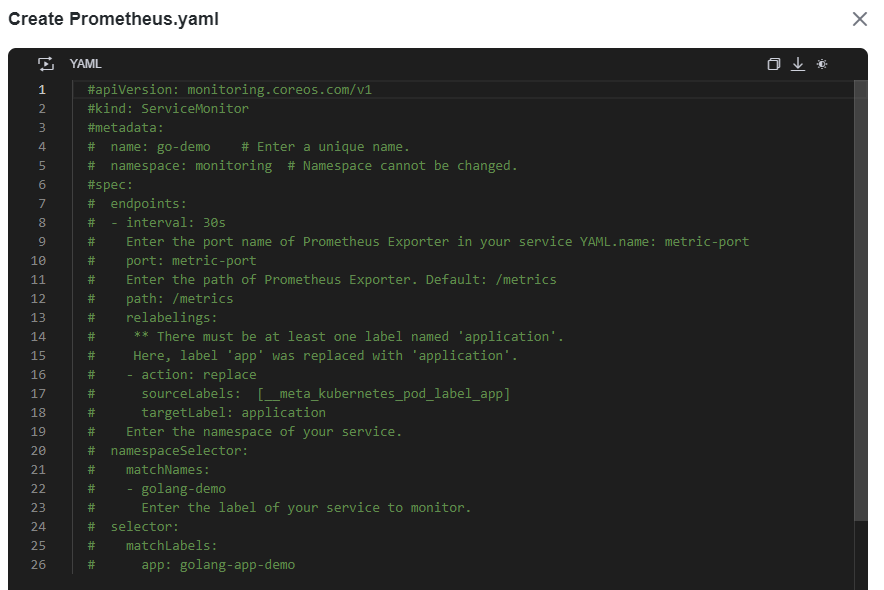
After the configuration is complete, the new collection rule is displayed in the list.
Adding PodMonitor
- Log in to the AOM 2.0 console.
- In the navigation pane on the left, choose Prometheus Monitoring > Instances.
- In the instance list, click a Prometheus instance for CCE.
- In the navigation pane on the left, choose Metric Management. On the Settings tab page, click PodMonitor.
- Click Add PodMonitor. In the displayed dialog box, set related parameters and click OK. Figure 2 Adding PodMonitor
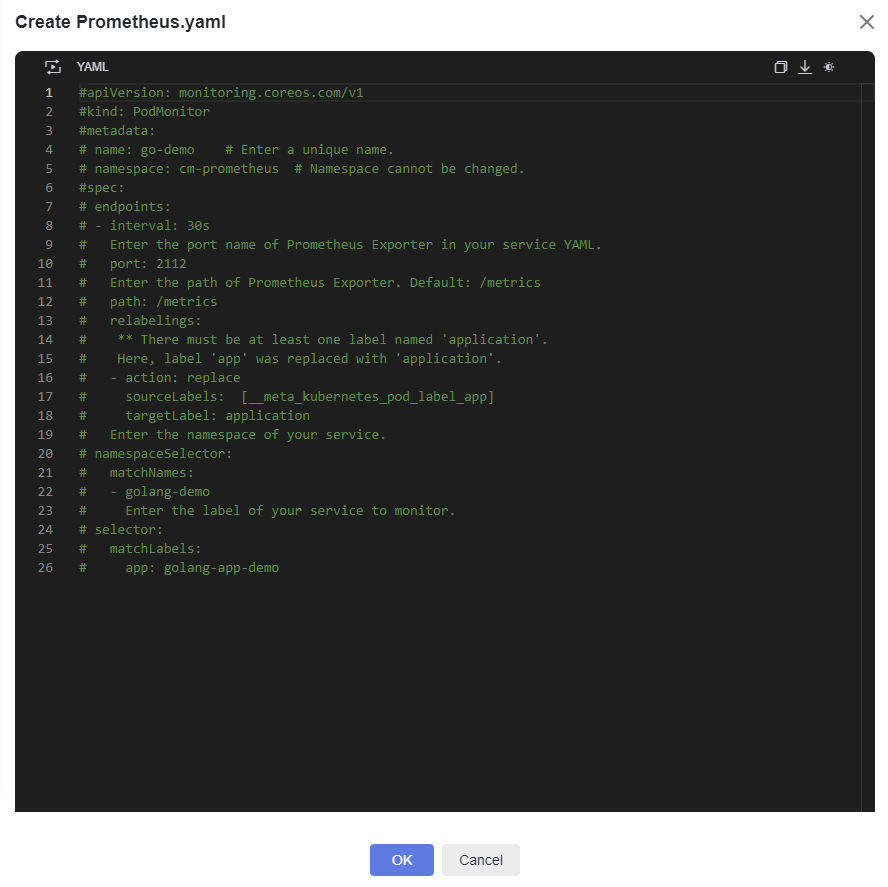
After the configuration is complete, the new collection rule is displayed in the list.
Other Operations
Perform the operations listed in Table 1 if needed.
| Operation | Description |
|---|---|
| Checking metric management configuration |
|
| Enabling or disabling collection rules | On the Settings tab page of the Metric Management page, click |
| Deleting metric management configuration | Click |


Feedback
Was this page helpful?
Provide feedbackThank you very much for your feedback. We will continue working to improve the documentation.


